
National Lacrosse League Touches: Who Has the Ball?
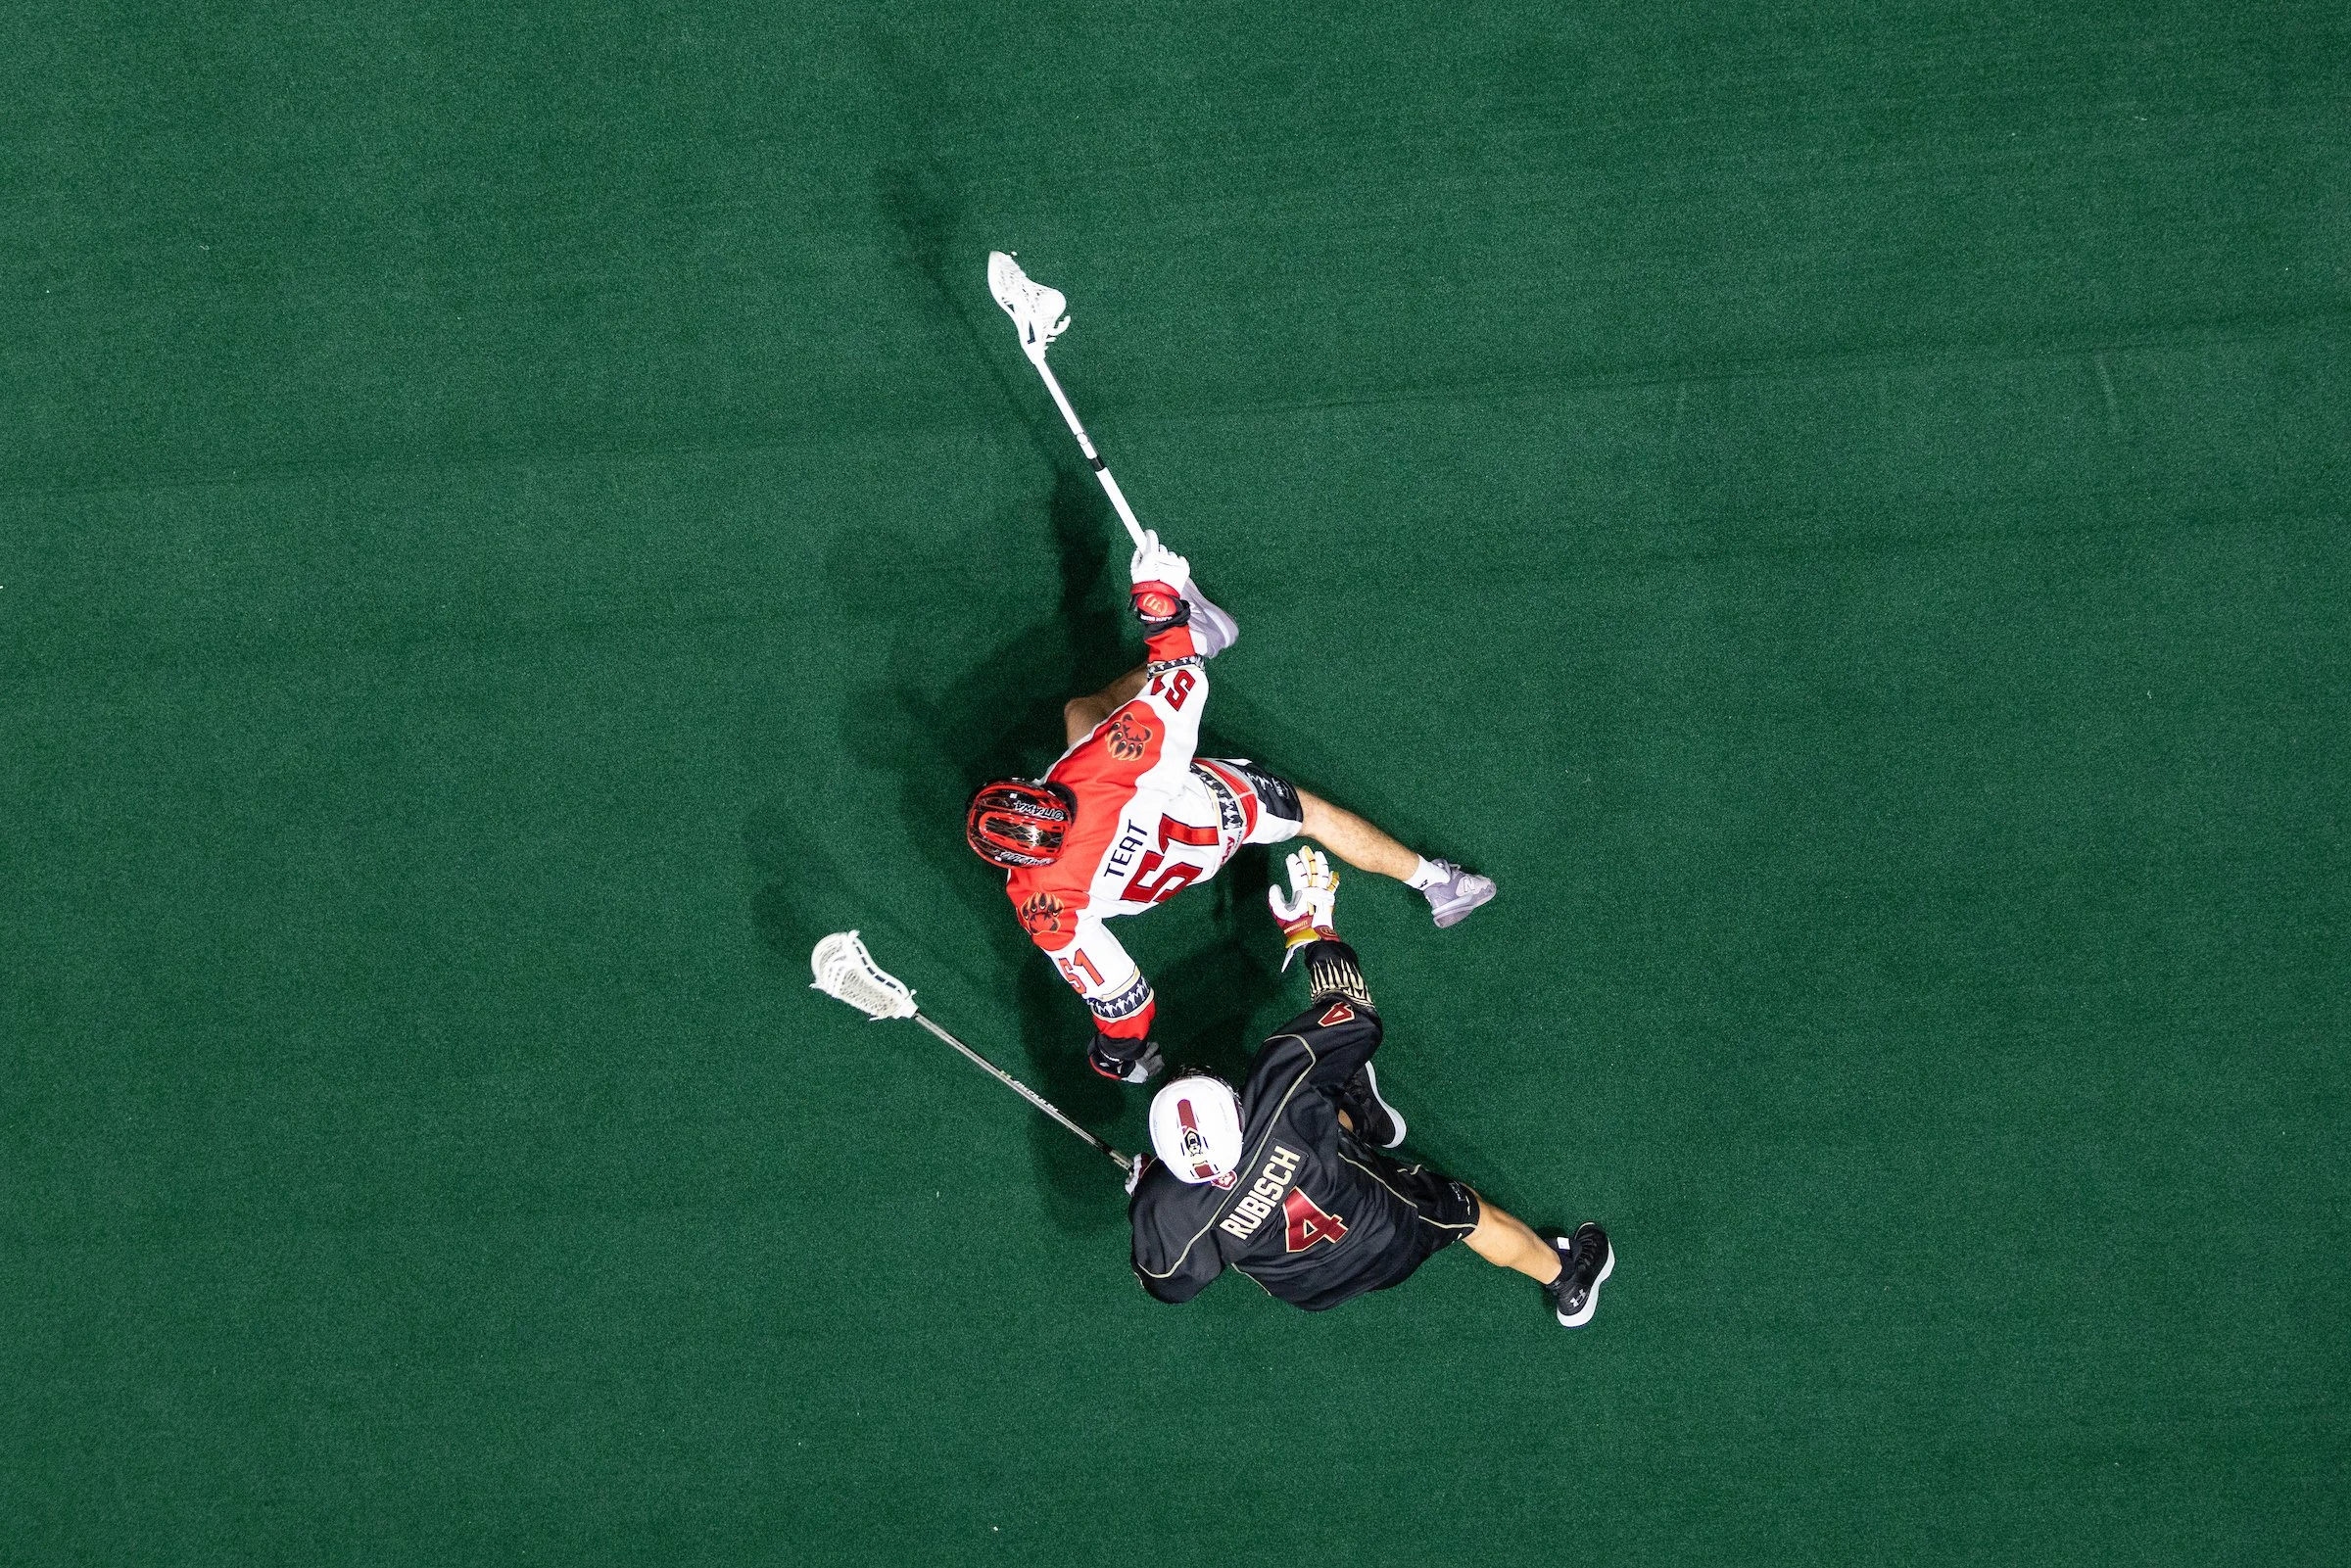
Jeff Teat, Ottawa Black Bears (Photo: David Pickering)
Although not available to the average fan anywhere online, the National Lacrosse League has internally been tracking two interesting individual player statistics in recent seasons: touches and effective passes.
Cool, sure, but what are they exactly?
While the league has not made any type of formal announcement defining this data, we’ll take a shot.
The National Basketball Association, which (basketball that is) shares more on-floor strategy with box lacrosse than any other sport, defines their touches as, “A stat counts the number of times a player touches and possesses the ball during a game, typically in offensive/attacking contexts.”
In addition to simply tracking touches, the NBA also maintains additional analytics like front-court touches, average seconds per touch, average dribbles per touch, and other scenario-specific, touch-related data.
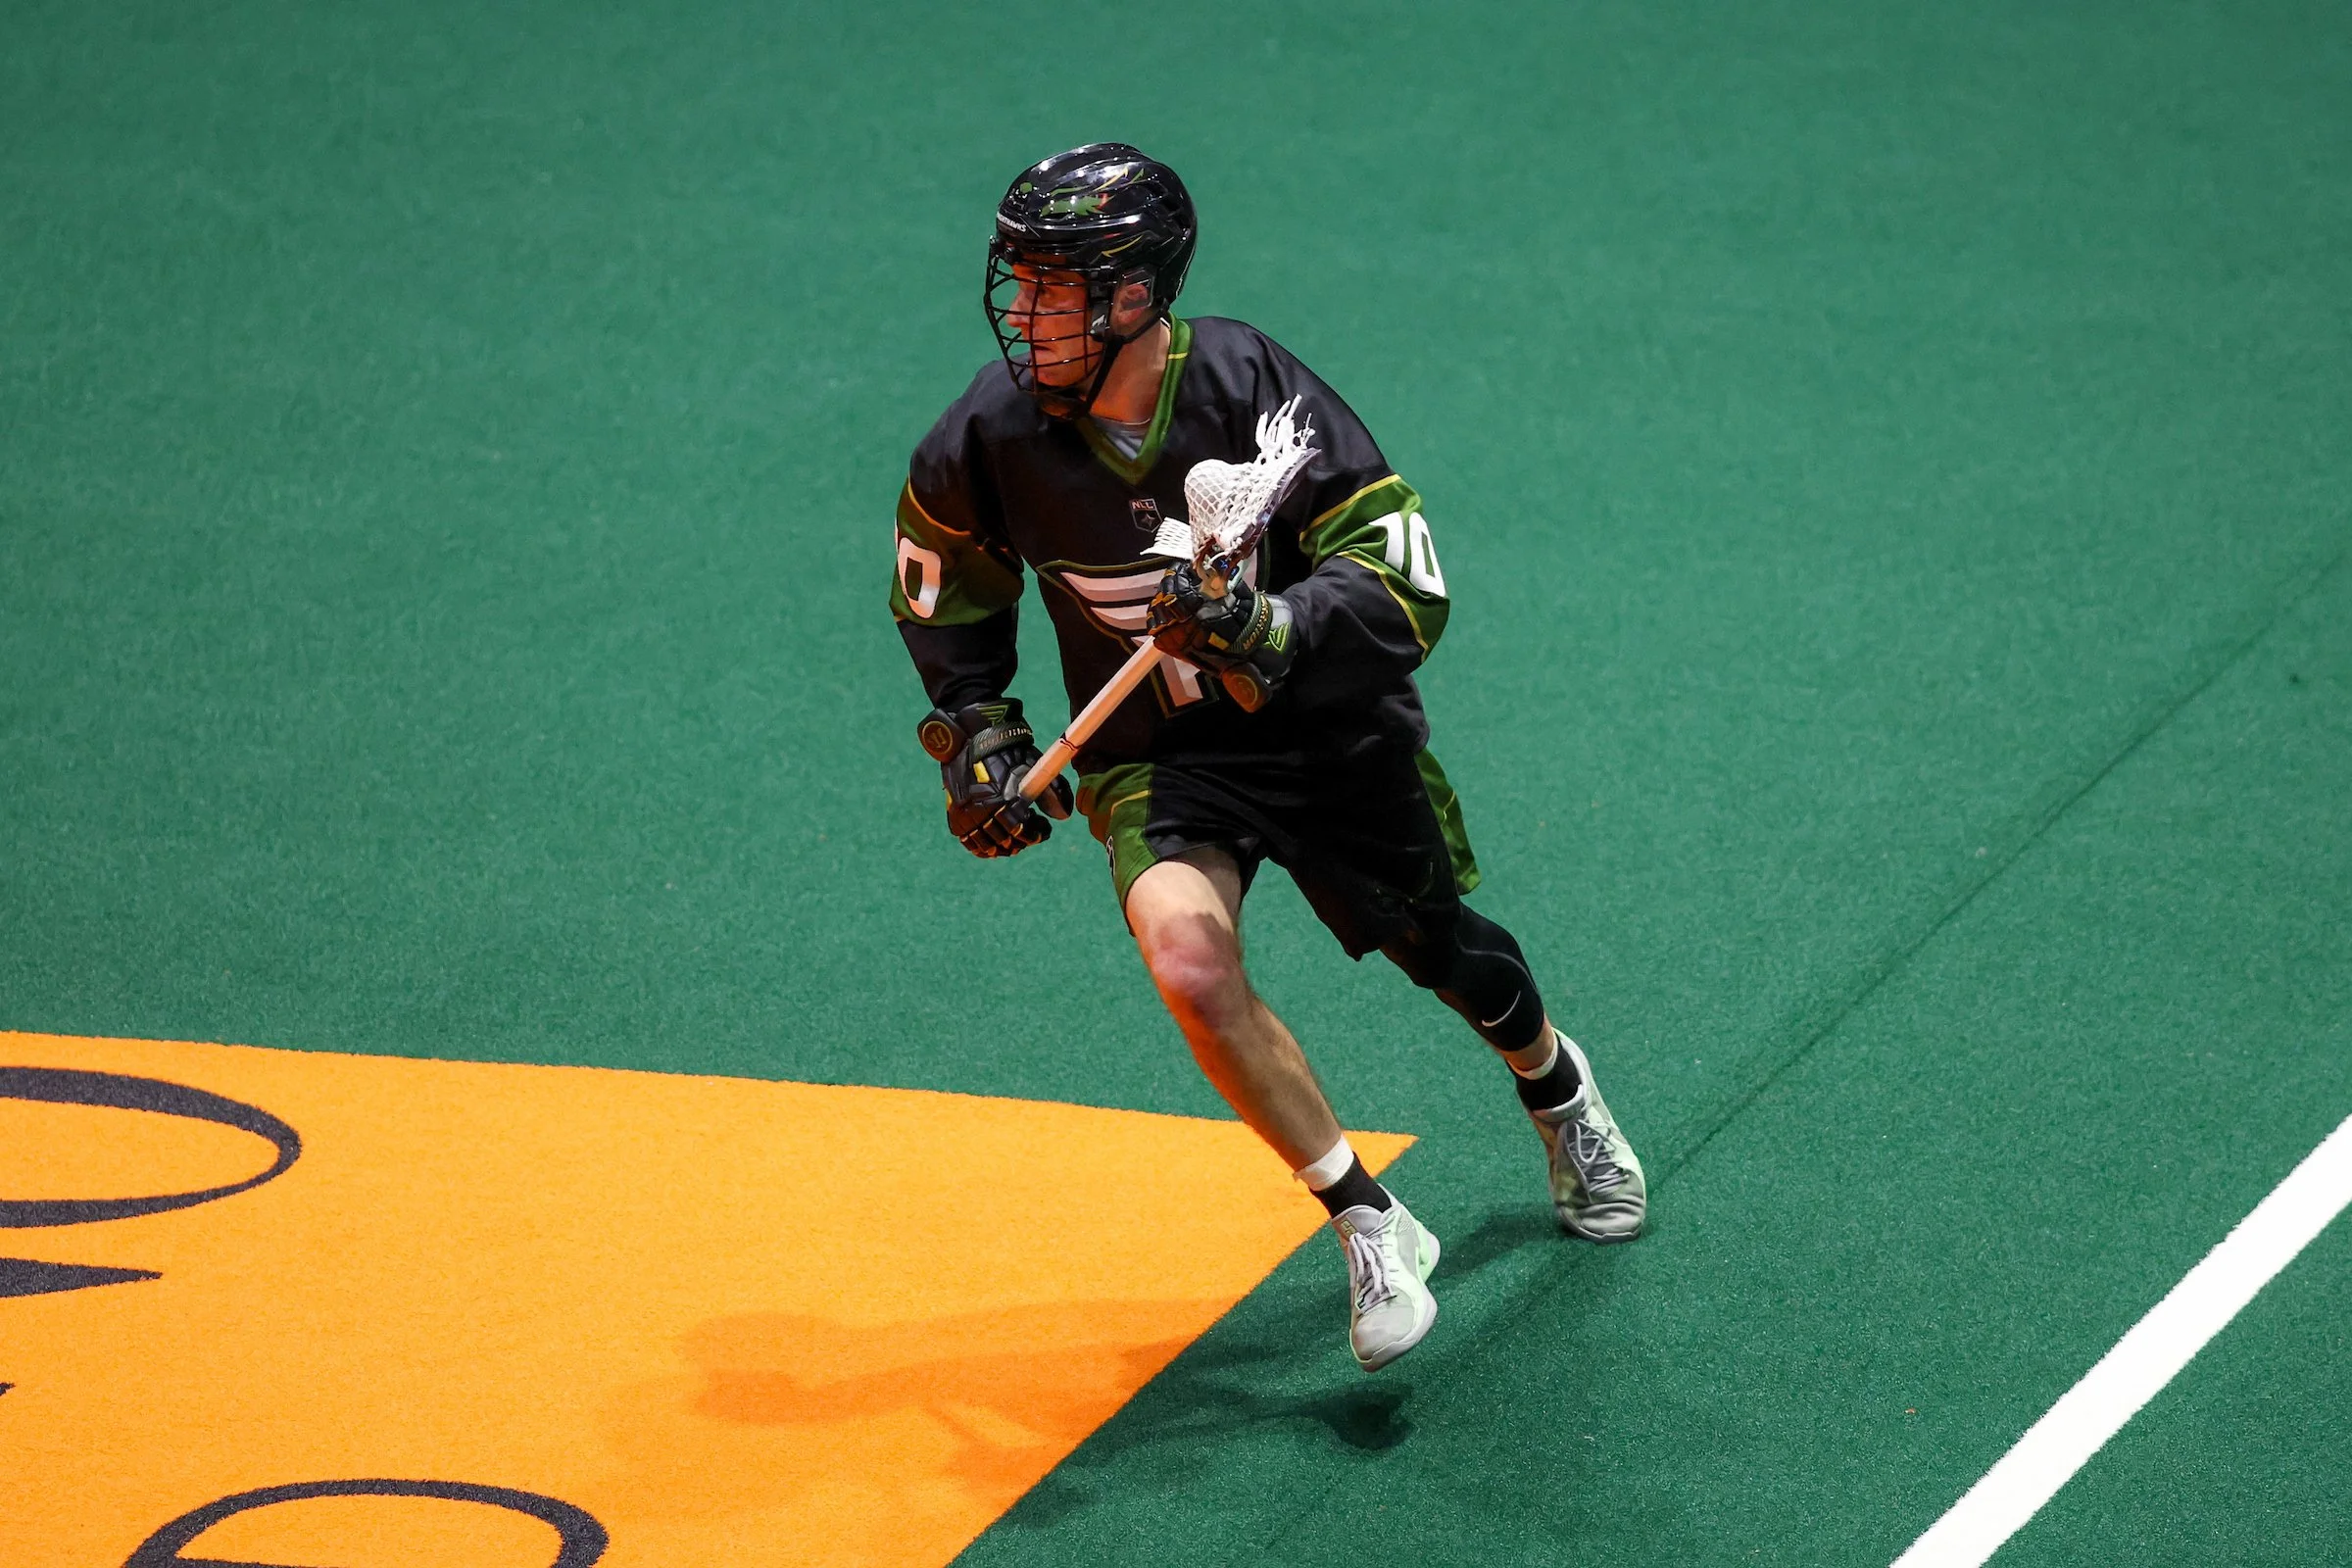
Connor Fields, Rochester Knighthawks (Photo: Jonathan Tenca)
While the NLL touch stat doesn’t get into all those extra breakdowns, their touch stat ultimately tracks the same possession-specific data the NBA’s touch-only number does… how many in-game instances does a player have the ball, for however long or short the ball is in your stick.
A touch in the NLL would seemingly largely include either accepting a pass or gaining possession via a loose ball. Based on how the numbers for players add up, a player winning a face-off cleanly or starting with the ball after a stoppage would also count – we think.
Every player’s touch stat also exactly equals (in every single case, we checked) the four actions they can achieve once the ball leaves their twig: a shot on goal, a shot off goal, a turnover, or the NLL’s other newish tracked stat, an effective pass.
An effective pass is seemingly a clean pass from one same-team player to another. Instance like a player fumbling the ball and their teammate scooping it up off the floor would get classified as a loose ball, not an effective pass.
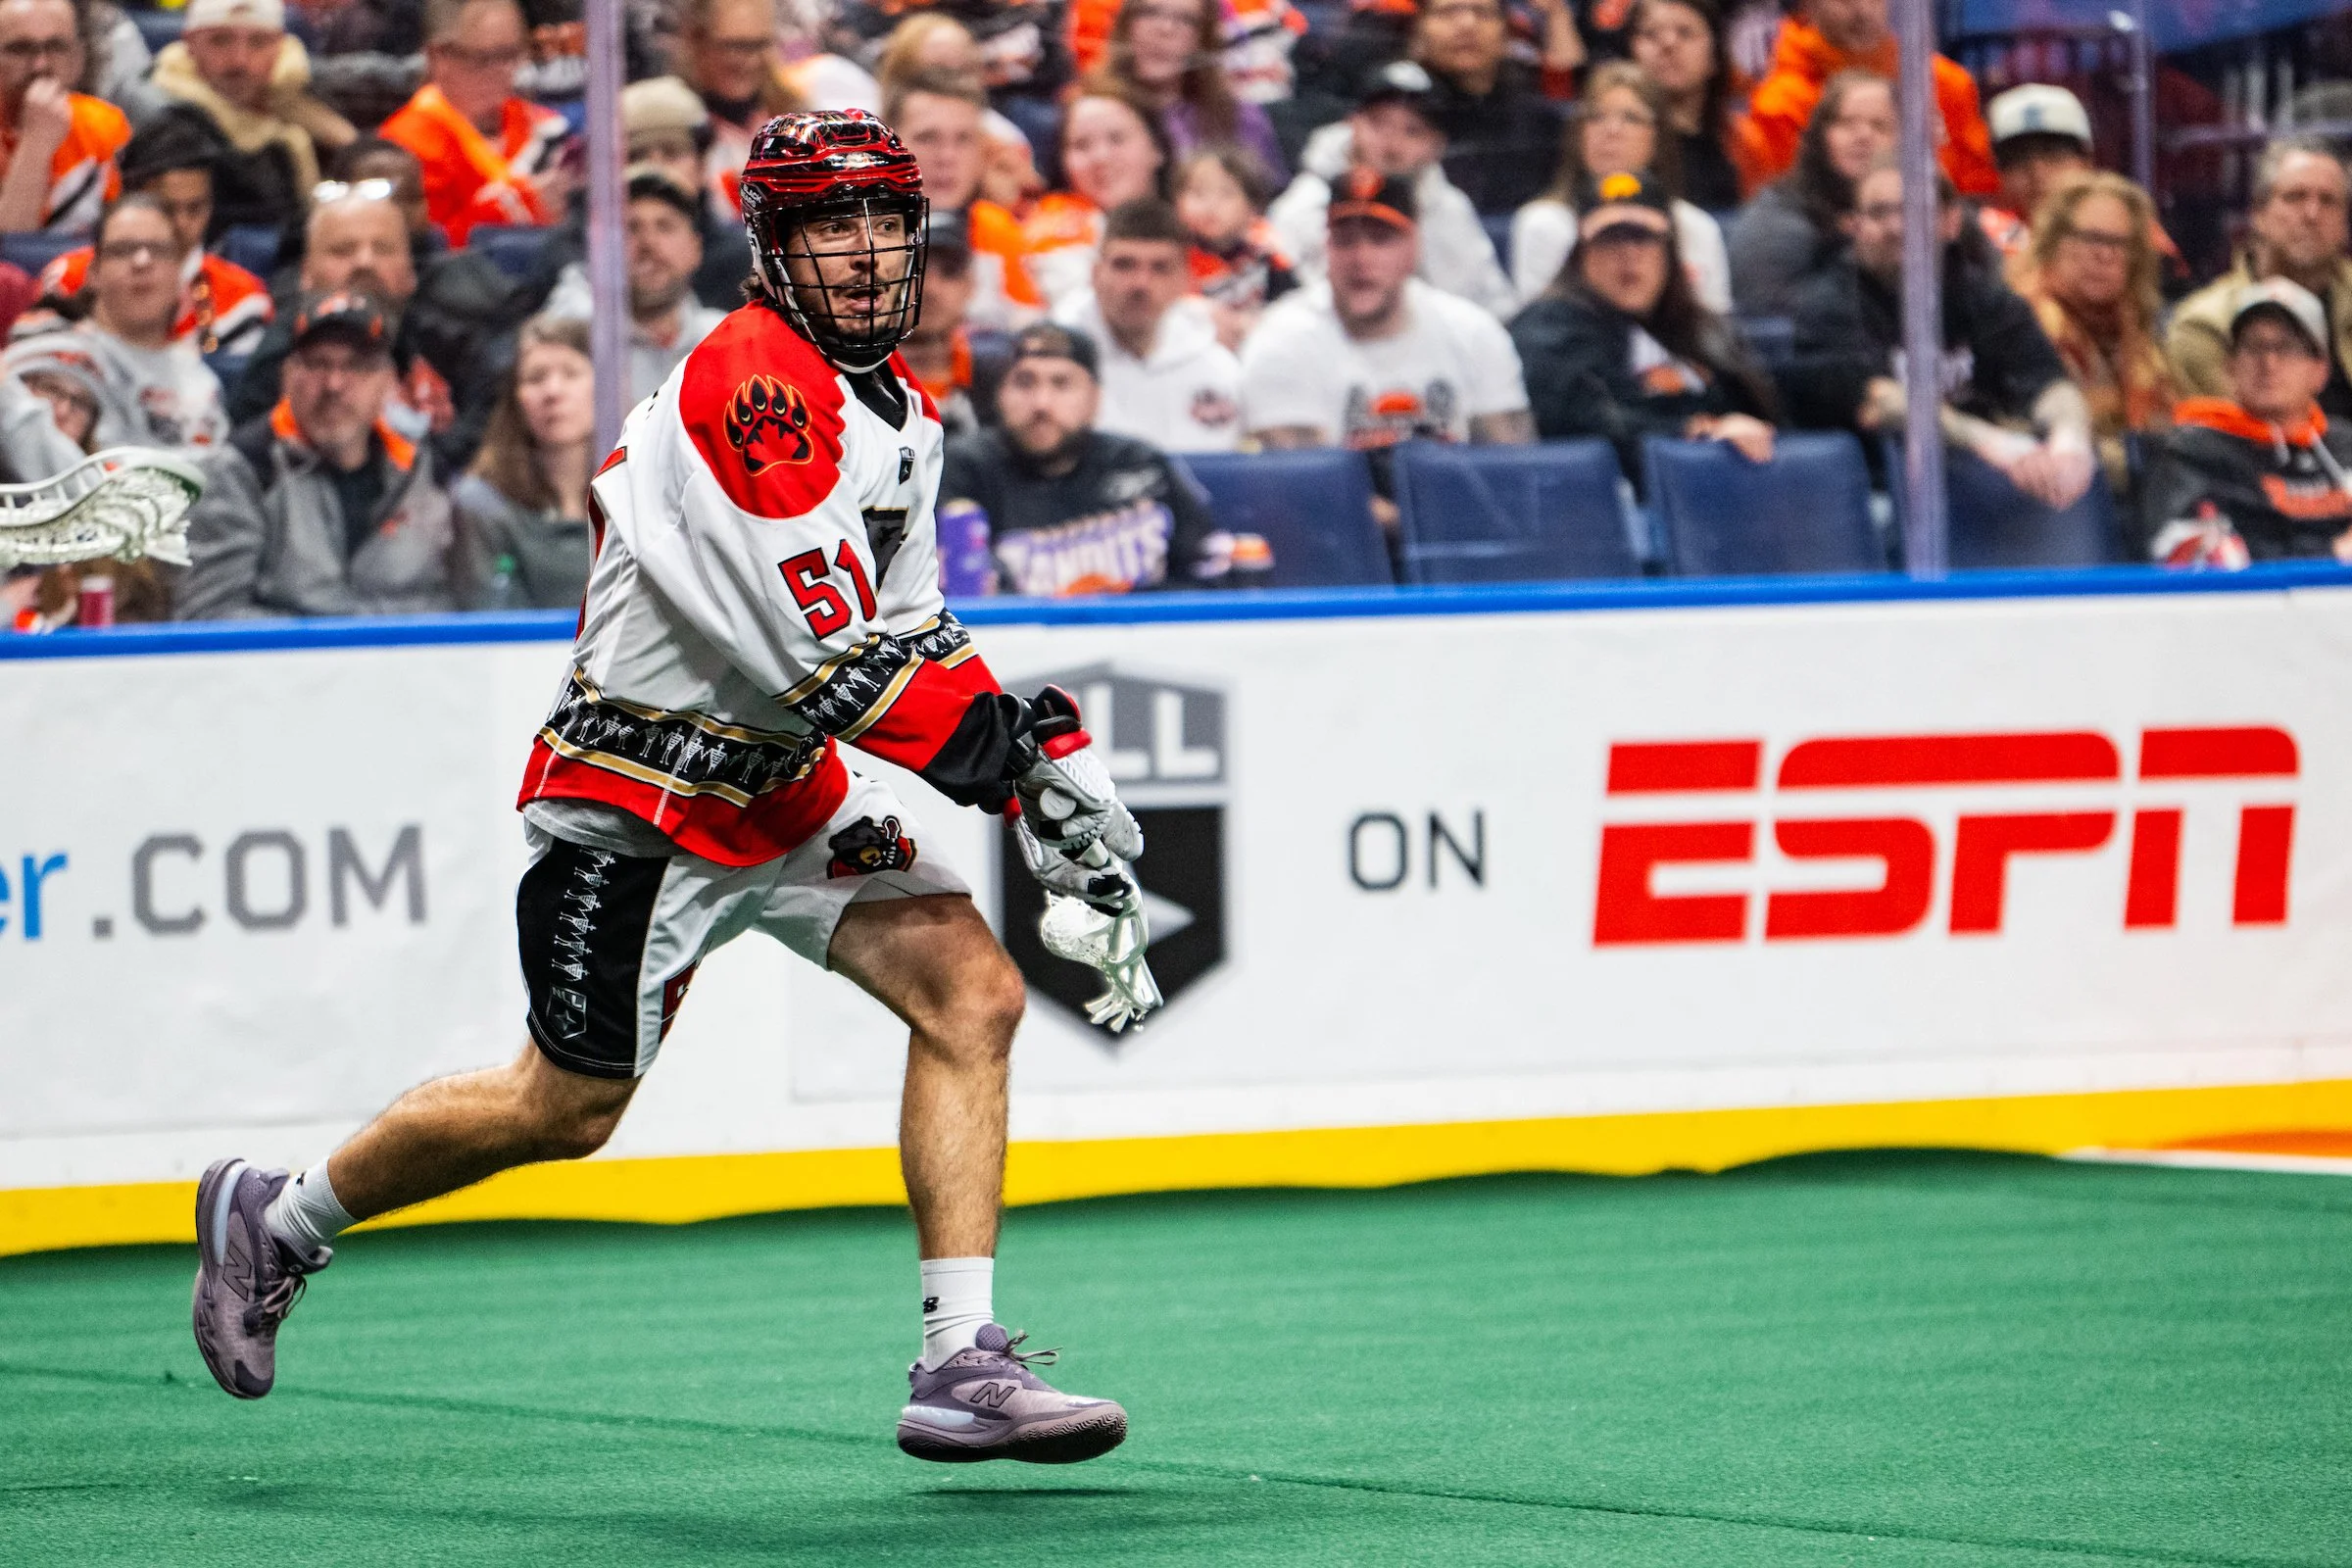
Jeff Teat, Ottawa Black Bears (Photo: Caroline Sherman)
So now that we have a better idea of what these stats likely mean, which players are dominating in touches, effective passes, and other related areas so far this season?
Touches Per Game
Not all that surprisingly, most of today’s top-performing offensive players rank really high here, Ottawa’s Jeff Teat averaging 95.3 touches per game heading into Week 10. Other players, like Halifax forward Randy Staats, has the sixth highest touch average, but his points per game presently (4.4) rank him just 29th across the NLL. Below are the touch-per-game leaders (plus their points per game and where that ranks ahead of Week 10).
Jeff Teat (OTT) 95.3 (7.1 - 4th)
Dhane Smith (BUF) 93.0 (7.3 - 2nd)
Connor Fields (ROC) 89.8 (7.7 - 1st)
Rob Hellyer (OTT) 83.6 (6.0 - T9th)
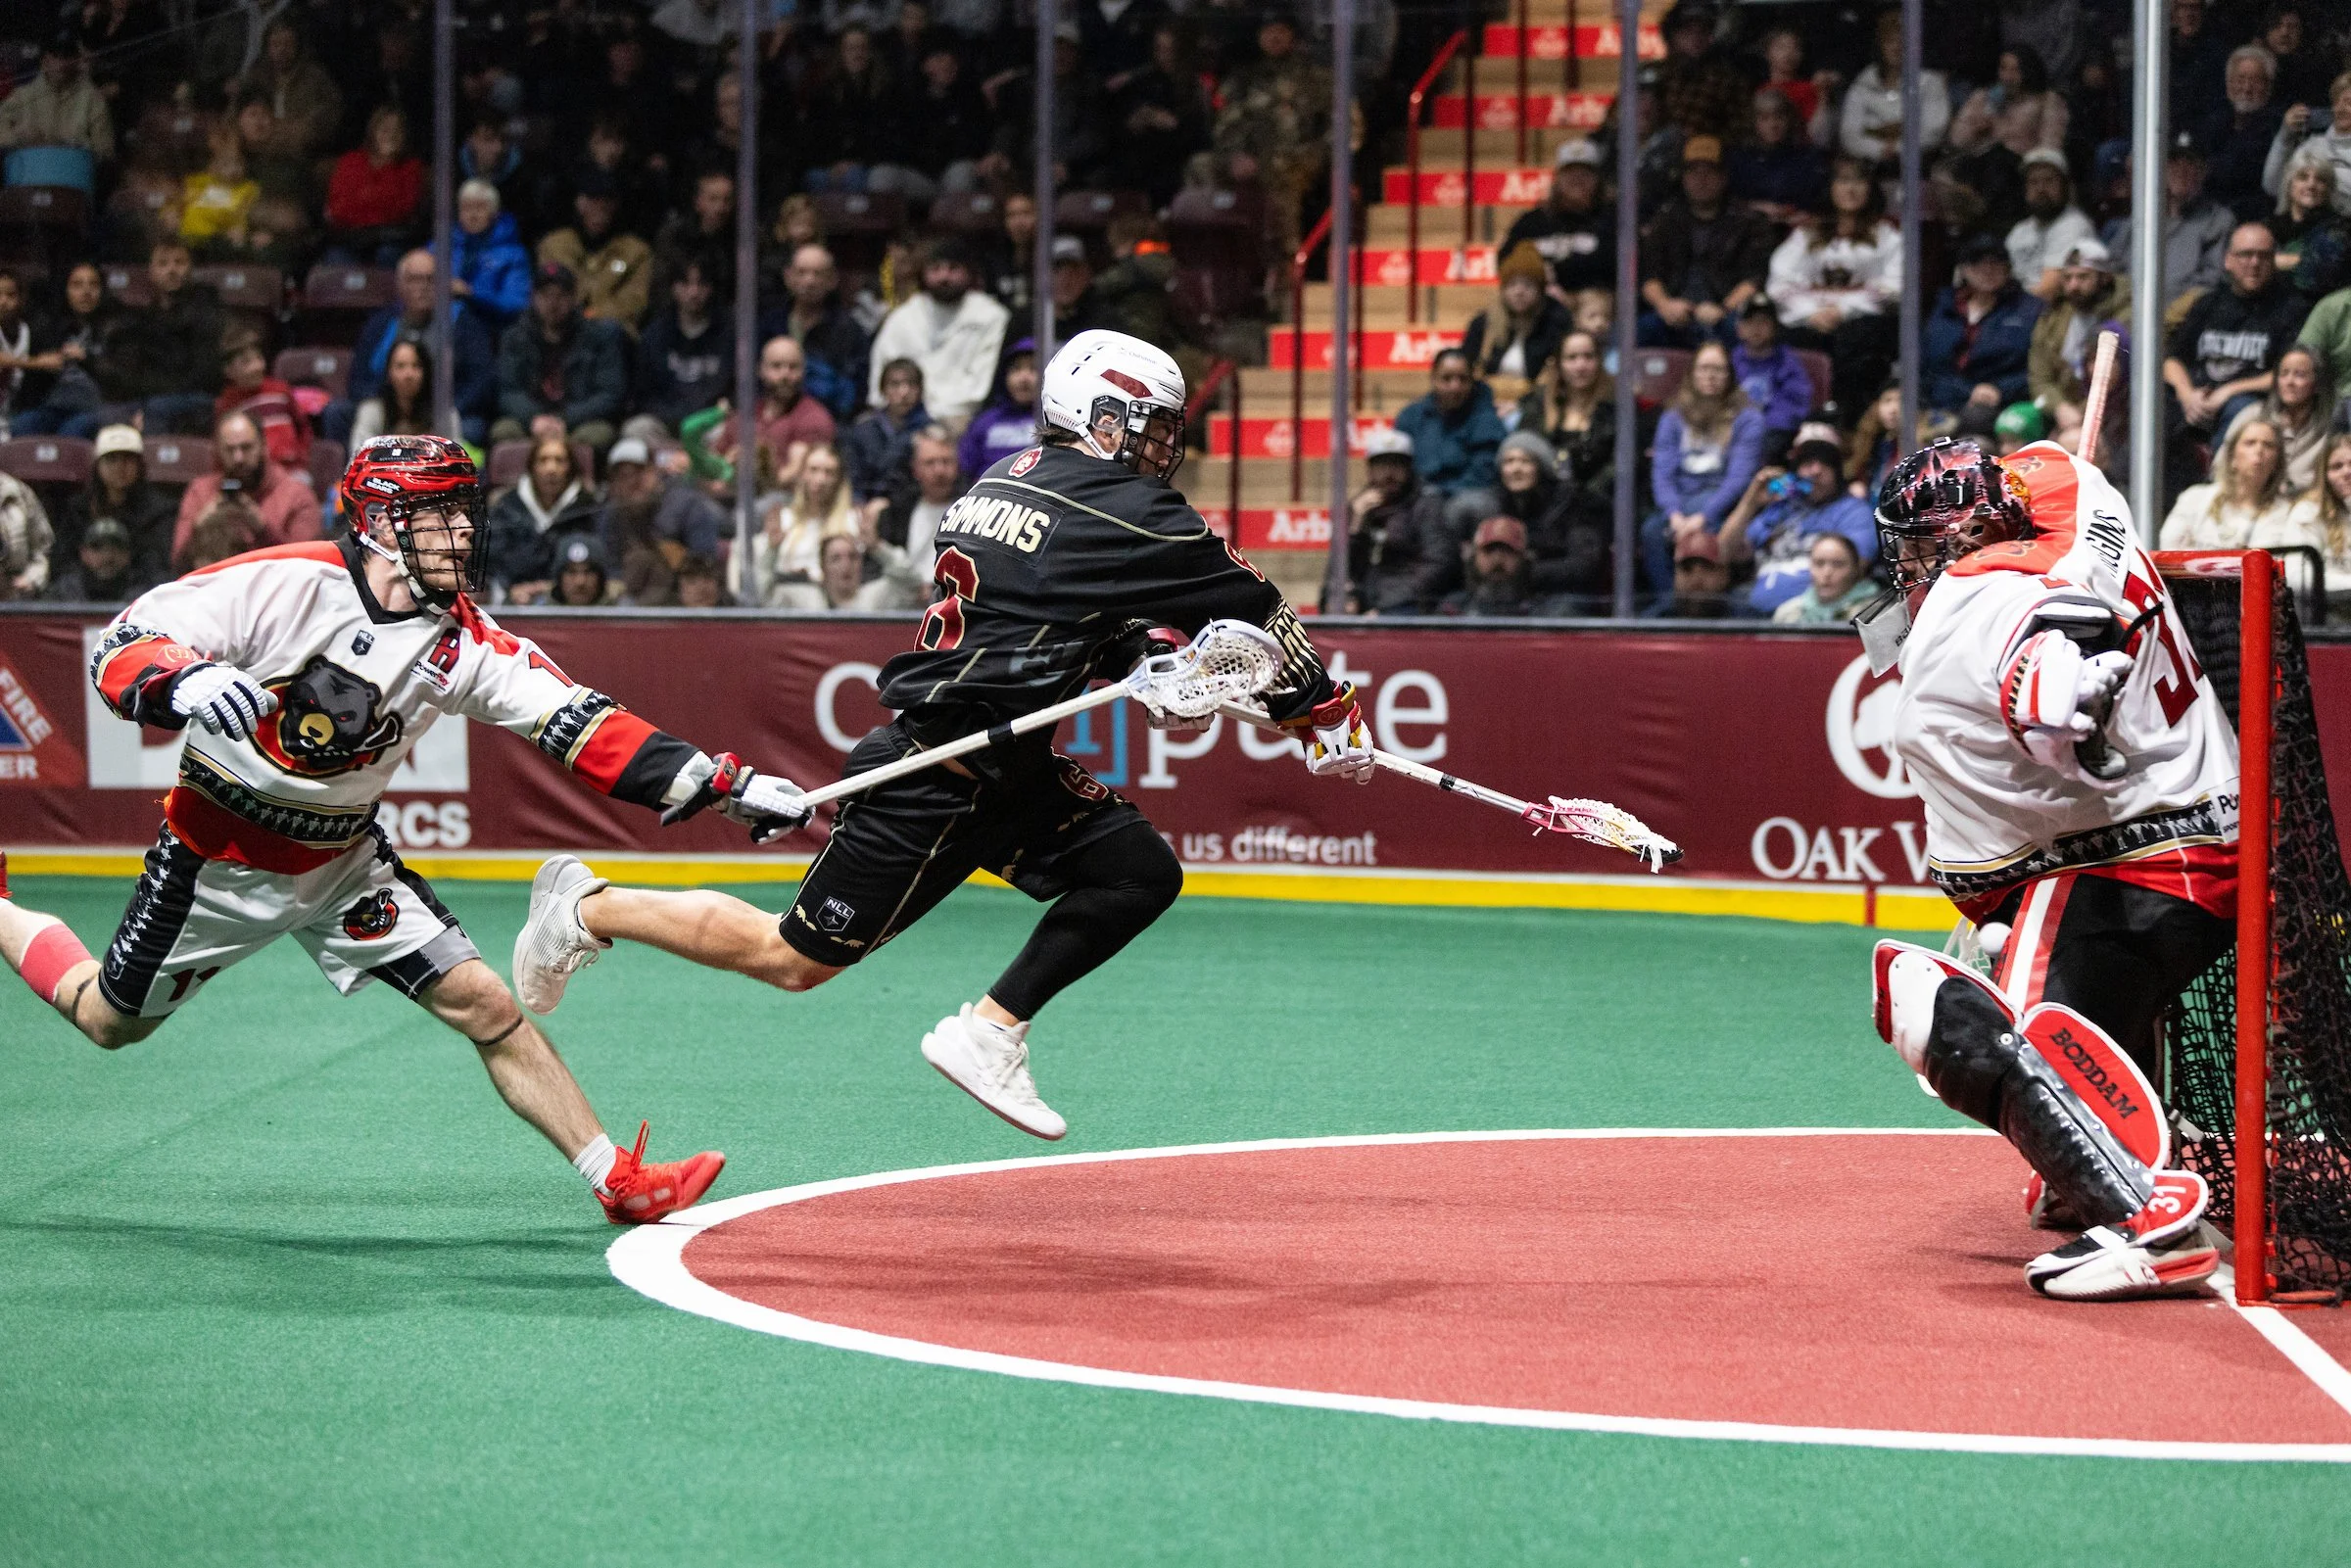
Alex Simmons (OSH) 82.5 (6.1 - 8th)
Randy Staats (HFX) 78.4 (4.4 - 29th)
Keegan Bal (VAN) 78.3 (6.2 - T6th)
Tyler Pace (CAL) 76.7 (6.0 - T9th)
Clarke Petterson (HFX) 74.0 (4.3 - T31st)
Ryan Lanchbury (ROC) 73.0 (6.3 - 5th)
Tanner Cook (CAL) 73.0 (5.7 - 14th)
Mitch Jones (LV) 70.0 (6.2 - 6th)
Brayden Mayea (CAL) 69.7 (4.5 - T24th)
Wesley Berg (SD) 69.3 (3.8 - T37th)
Brennan O'Neill (PHI) 69.2 (5.0 - T19th)
Will Malcom (COL) 69.1 (5.9 - T11th)
Robert Church (SK) 68.3 (4.3 - 31st)
Josh Byrne (BUF) 68.0 (5.8 - 13th)
Lyle Thompson (GA) 65.4 (3.7 - T39th)
Tre Leclaire (SD) 64.2 (4.5 - 24th)
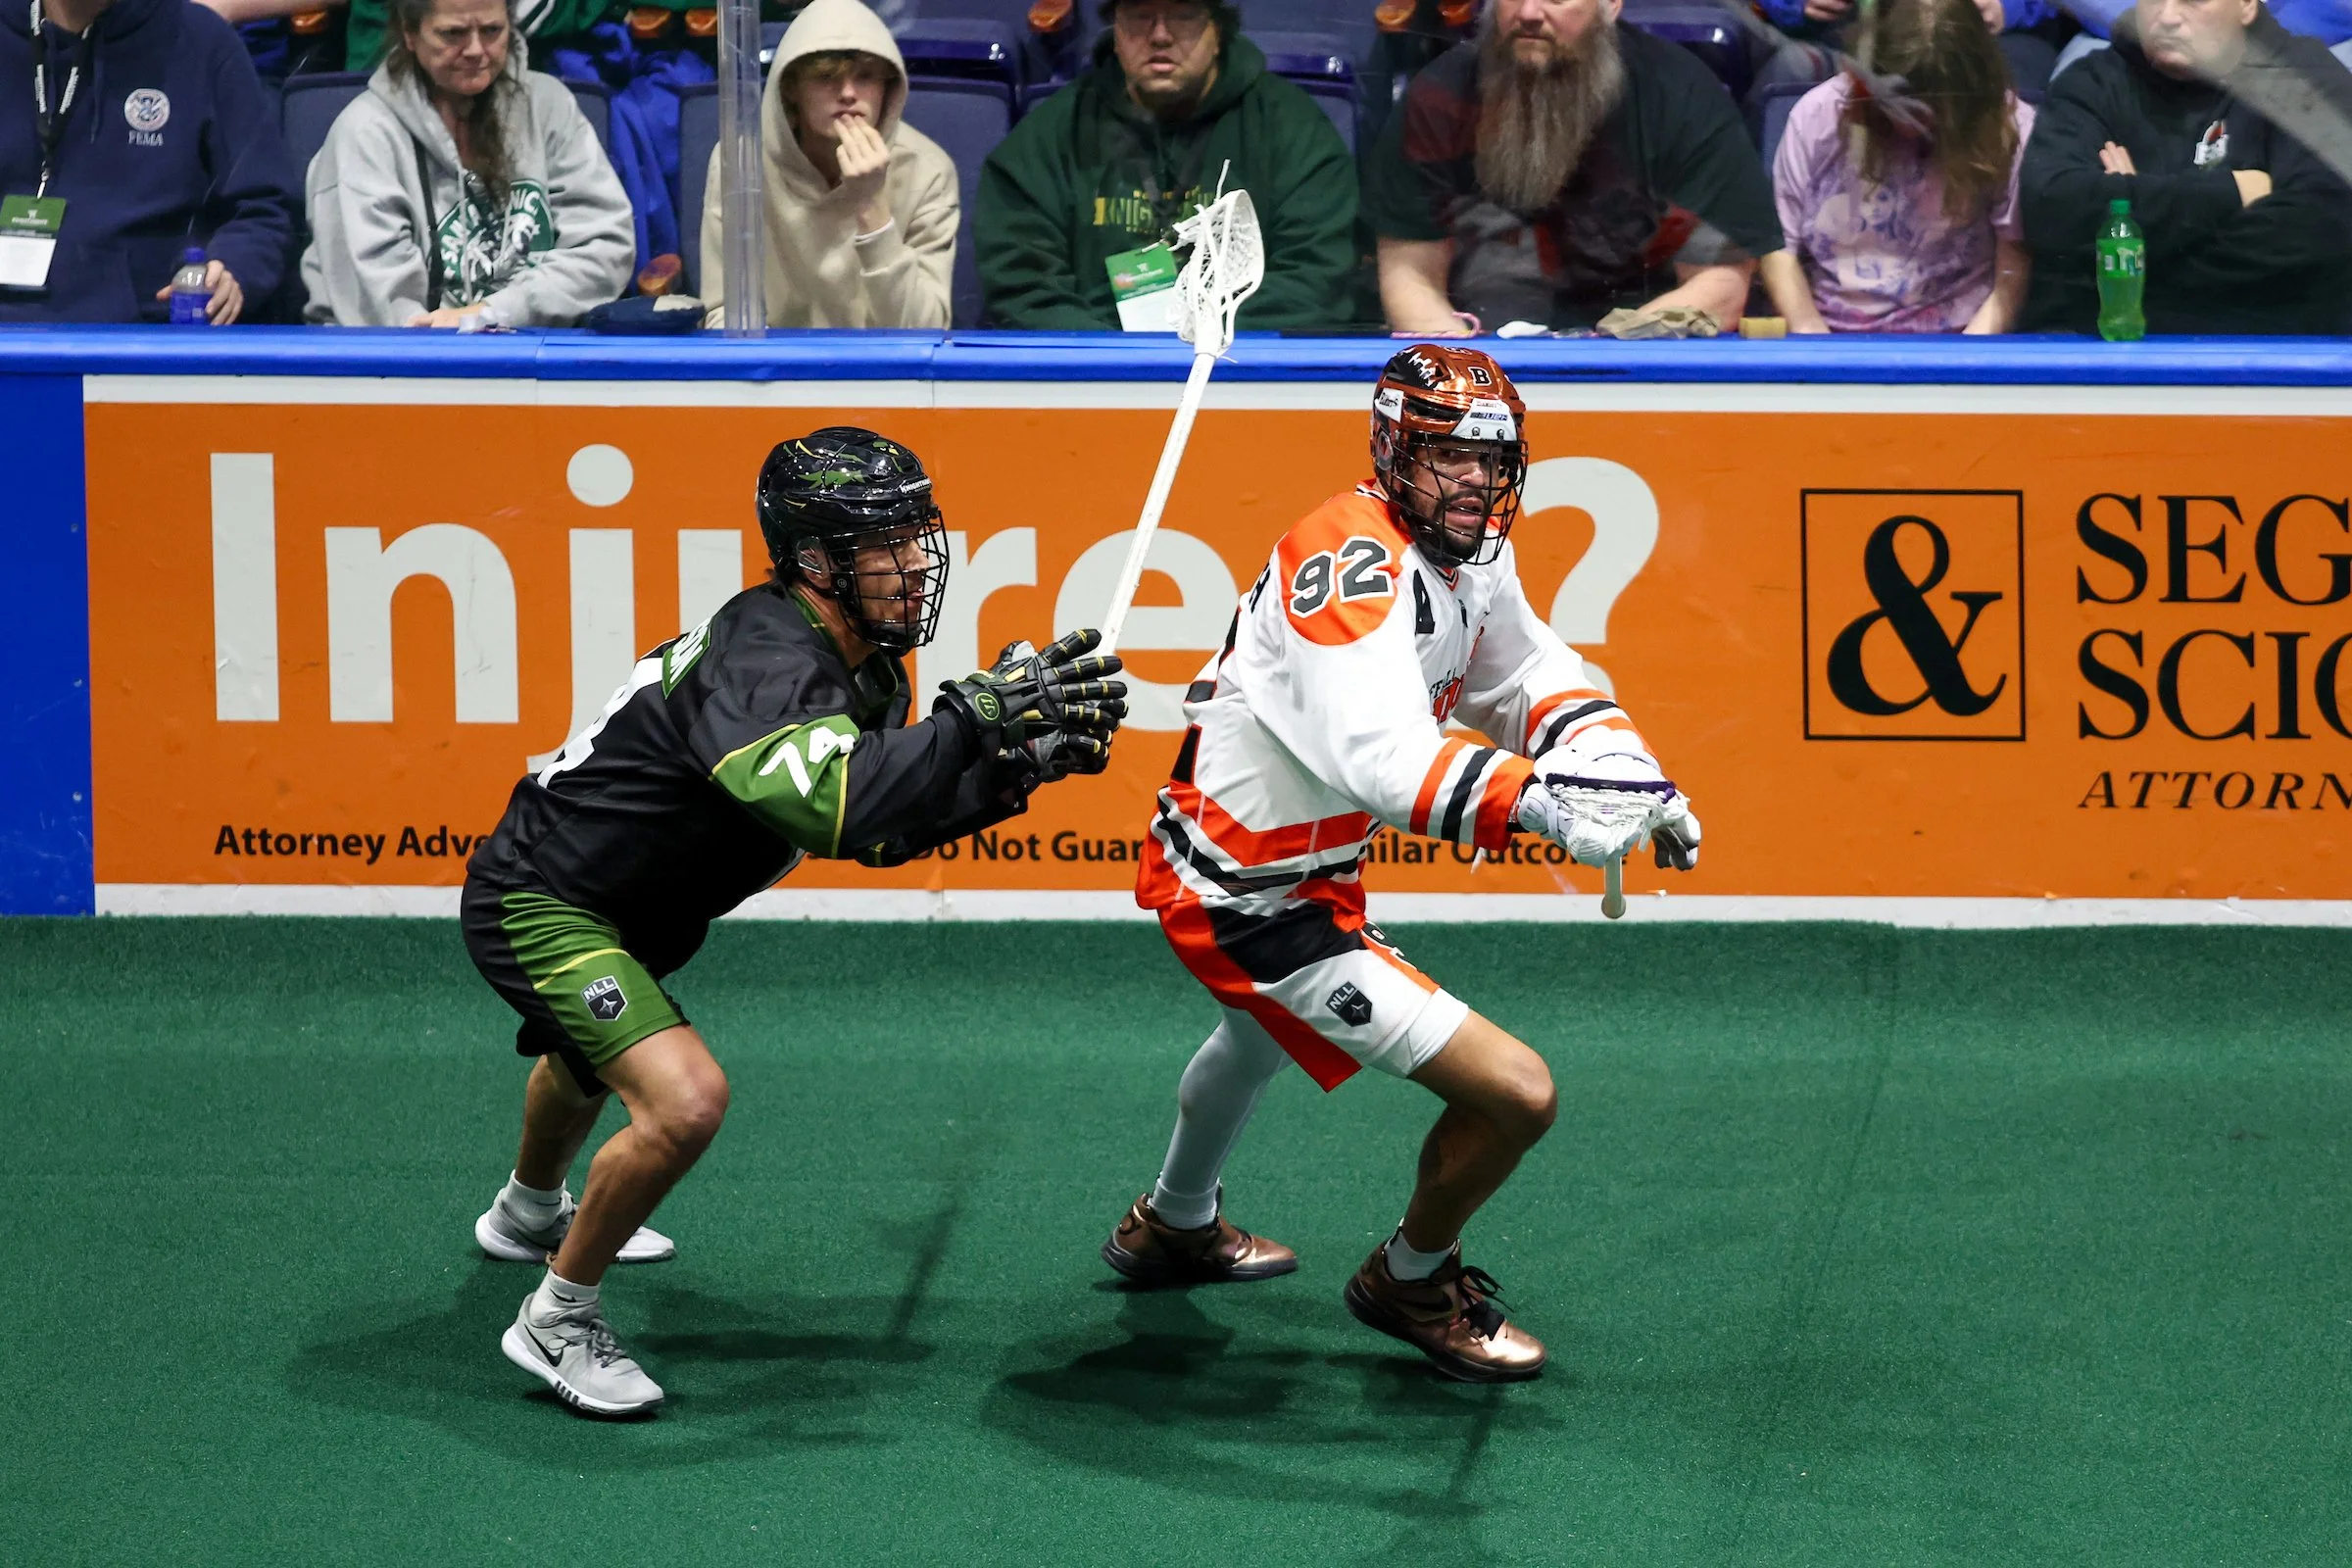
Dhane Smith, Buffalo Bandits (Photo: Jonathan Tenca)
Effective Passes Per Game
When it comes to effective passes, most of the same players appear here, which kinda makes sense, right? Why would you keep feeding the same player the ball if they sucked at passing (or scoring) consistently. The NLL’s single-season assists leader (a record he’s famously reset in each of the last four seasons), Dhane Smith, tops this list with 72.8 effective passes per game after the NLL’s Week 9.
Dhane Smith (BUF) 72.8
Jeff Teat (OTT) 70.1
Connor Fields (ROC) 69.2
Rob Hellyer (OTT) 64.9
Tyler Pace (CAL) 64.2
Keegan Bal (VAN) 60.7
Alex Simmons (OSH) 59.8
Ryan Lanchbury (ROC) 59.5
Randy Staats (HFX) 58.4
Mitch Jones (LV) 56.2
Clarke Petterson (HFX) 56.0
Brayden Mayea (CAL) 55.8
Wesley Berg (SD) 54.3
Tanner Cook (CAL) 52.8
Will Malcom (COL) 51.6
Brennan O'Neill (PHI) 50.8
Robert Church (SK) 50.6
Ryan Lee (COL) 50.3
Tre Leclaire (SD) 50.0
Josh Byrne (BUF) 49.5
While the above players are possessing and effectively feeding the ball the most, who is passing precisely the most but with fewer touches per game?
The league average for touches per game right now is 21.4. To focus on full-time players who own above average possession, we pulled players averaging at least 22 touches per game and have played in at least half their team’s games. Basically, we don’t a statistical pull full of defenders that have played a game or two and have connected on all four of the times they’ve fed a teammate.
Below are the players with the highest effective passes per touch using the above quoted criteria.
Ryan Terefenko, Halifax Thunderbirds (Photo: Trevor McaMillan)
Effective Passes Per Touch
Ryan Terefenko (HFX) 0.89
Brendan Bomberry (HFX) 0.84
Tyler Pace (CAL) 0.84
Challen Rogers (TOR) 0.83
Kaleb Benedict (GA) 0.83
Zach Currier (SD) 0.83
Blaze Riorden (PHI) 0.83
Noah Manning (CAL) 0.83
Sean Westley (LV) 0.82
Reilly O'Connor (OTT) 0.82
Ethan Walker (OSH) 0.82
Ryan Lanchbury (ROC) 0.82
Taggart Clark (OSH) 0.82
Mark Matthews (TOR) 0.81
Cody Jamieson (HFX) 0.81
Mitch Jones (LV) 0.80
Brayden Mayea (CAL) 0.80
Ryan Lee (COL) 0.80
Braedon Saris (COL) 0.80
It’s interesting to see the Halifax Thunderbirds with multiple names so high on this passing-efficiency pull after confirming last week a number of their top players have seen some of the most significant statistical declines this year, plus as we’ll find out shortly, are turning over the ball and shooting off target at really high rates this season too.
While NLL.com provides a player’s total Shots On Goal, internally they also track Shots Off Goal and then of course total Total Shots. So let’s take a quick look at that split shots stat too.
Alex Simmons, Oshawa FireWolves (Photo: David Pickering)
Shots On Goal Per Game
Teat is tops again, and many of the same names who we outlined above were doing much of the heavy offensive lifting for their team here too. Last year’s second-highest goal scorer, Ryan Smith, is still hitting the net a lot (5th highest below), but has lost almost a full goal per game from last year, in addition to seeing his shooting percentage plunge 10.4%. With that said, Smith is seeing an ever sharper spike in his assist per this year, Rochester sporting a slightly different look up front with the addition of Zed Williams this year.
Toronto Rock rookie CJ Kirst leads all first-year players with 9.3 shots on target per outing, and although he didn’t crack our Top 20 pull below, San Diego Seals rookie forward Pat Kavanagh, who was our third highest ranked rookie a few weeks back, isn’t far off at 8.8. Although no longer a rookie after playing 11 times last year for Calgary, Brayden Mayea’s name keeps coming up in positive pulls today, and in last week’s most improved stats review too.
Jeff Teat (OTT) 14.4
Alex Simmons (OSH) 13.3
Connor Fields (ROC) 13.2
Dhane Smith (BUF) 12.3
Ryan Smith (ROC) 11.5
Josh Byrne (BUF) 11.3
Brennan O'Neill (PHI) 11.2
Tanner Cook (CAL) 11.0
Robert Church (SK) 11.0
Will Malcom (COL) 10.7
Rob Hellyer (OTT) 10.5
Brayden Mayea (CAL) 9.8
Tre Leclaire (SD) 9.7
Tye Kurtz (OSH) 9.5
Curtis Dickson (VAN) 9.5
Keegan Bal (VAN) 9.3
Wesley Berg (SD) 9.3
CJ Kirst (TOR) 9.3
Randy Staats (HFX) 9.3
Thomas McConvey (ROC) 9.2
Chris Cloutier (LV) 9.2
Randy Staats, Halifax Thunderbirds (Photo: Trevor MacMillan)
Shots Off Goal Per Game
This list is filled with players like Teat, who is just so heavily relied on and involved in Ottawa’s overall offense, he’s also missing the net a high number of times too (but again, has the ball in his twig almost 100 time per game), and also players whose offensive output is struggling mightily so far this season. Again, for those names, check out last week’s review of the year’s most significant per-game stat spikes and slumps.
Randy Staats (HFX) 6.4
Jeff Teat (OTT) 6.3
Connor Fields (ROC) 6.0
Dylan Watson (SD) 5.4
Alex Simmons (OSH) 5.3
Jack Hannah (COL) 5.3
Tanner Cook (CAL) 5.2
Connor Robinson (SD) 4.7
Dyson Williams (OSH) 4.6
Rob Hellyer (OTT) 4.5
Tyler Pace (CAL) 4.5
Shayne Jackson (GA) 4.4
Nolan Byrne (GA) 4.4
Josh Byrne (BUF) 4.3
Wesley Berg (SD) 4.3
Joe Resetarits (PHI) 4.3
Lyle Thompson (GA) 4.3
Clarke Petterson (HFX) 4.3
Dawson Theede (HFX/OSH) 4.3
Chase Fraser (LV) 4.2
Jesse King (VAN) 4.2
No team is seeing a higher percentage of their shots not hitting the net than the Thunderbirds right now (over a third of their shots are missing the mark), plus at 26 team turnovers a game, Halifax is also averaging the most giveaways per in the league presently. Both of those trends are reflective in the lists directly above and below (plus last week’s 2025 vs. 2026 player stat tracking). Last year, Halifax averaged a very healthy 13.1 goals per game. This year? Just 9.1.
Clarke Petterson, Halifax Thunderbirds
Turnovers Per Game
Below are the straight-forward turnovers per game leaders.
Clarke Petterson (HFX) 5.6
Jeff Teat (OTT) 4.5
Keegan Bal (VAN) 4.5
Curtis Dickson (CAL) 4.3
Dhane Smith (BUF) 4.3
Randy Staats (HFX) 4.3
Alex Simmons (OSH) 4.3
Jack Hannah (COL) 4.0
Tanner Cook (CAL) 4.0
Nolan Byrne (GA) 4.0
Rob Hellyer (OTT) 3.8
Dawson Theede (HFX/OSH) 3.5
Brennan O'Neill (PHI) 3.5
Dalton Young (PHI) 3.5
Marcus Klarich (VAN) 3.5
Lyle Thompson (GA) 3.4
Austin Shanks (SK) 3.3
Jonathan Donville (LV) 3.2
Ryan Lanchbury (ROC) 3.2
Haiden Dickson (CAL) 3.2
Ian MacKay (BUF) 3.2
Chris Boushy (TOR) 3.2
Chris Cloutier (LV) 3.2
Teat again is super high here, and his haters will quickly point to the fact that he regularly has some of the worst turnover stats since entering the league, but that’s a terribly lazy take. As we’ve reviewed, Teat’s overall involvement in a game based on array of statistical analysis, including touches, is arguably more than any other player in the league today. Shocking, right?
Well, how about turnovers per touch then?
Using the same cut-off criteria we did earlier to mostly include full-time and more offensively engaged players (below includes players who average at least 22 touches per game – just over the league average – and have played at least half of their team’s games so far this season), here’s who “leads” there…
Marcus Klarich, Vancouver Warriors (Photo: David Pickering)
Turnovers Per Touch
Marcus Klarich (VAN) 0.12
Levi Anderson (SK) 0.10
Dalton Young (PHI) 0.10
Nolan Byrne (GA) 0.09
Chris Boushy (TOR) 0.09
Curtis Dickson (VAN) 0.09
Kean Moon (GA) 0.08
Thomas Vela (COL) 0.08
Connor Kearnan (OTT) 0.08
Jalen Chaster (COL) 0.08
Mike Robinson (HFX) 0.08
Jordan MacIntosh (GA) 0.08
Chris Cloutier (LV) 0.08
Clarke Petterson (HFX) 0.08
Dawson Theede (HFX/OSH) 0.07
Ian MacKay (BUF) 0.07
Austin Shanks (SK) 0.07
Jack Hannah (COL) 0.07
Jackson Webster (LV) 0.07
Phil Caputo (PHI) 0.07
Where does Teat rank here? He barely makes the Top 50 using our cut-off criteria (160th if you included every player in the league no matter their GP or TCH count), and when you consider he’s one of only four players in the league right now averaging 7.0 points or more, you can probably cut him some slack, huh?
What is maybe most amazing, however, is Rochester’s Connor Fields when looking at his points to turnover ratio. Fields is averaging the most points per game (7.7) across the NLL right now, yet somehow only sits 81st in turnovers per (1.5). Although there is still a lot of lacrosse left, that type of ratio is unheard of, and is something we’ll dig deeper into as Fields’ incredible season progresses.
Dawson Theede, who had an incredible breakout (yet injury shortened) season with Halifax last year, was recently traded to Oshawa. He is one of the few players to rank Top 20 in Shots Off Goal Per Game, Turnovers Per Game, and Turnovers Per Touch right now, in addition to leading the NLL in penalty minutes ahead of Week 10. As we saw before last week’s action in our weekly NLL Player Rankings post, Theede is down over a goal per game, is hitting the net far less, and giving the ball away far more in comparison to his strong 2025 run with the Thunderbirds.
And finally, who is producing the most points per touch? It’s a number you often see in various NBA player analysis, and may serve a purpose in the NLL too, but isn’t necessarily super straightforward.
Ryan Keenan, Saskatchewan Rush (Photo: Candice Ward)
Points Per Touch
Ryan Benesch (BUF) 0.12
Thomas McConvey (ROC) 0.12
Ryan Keenan (SK) 0.11
Chris Cloutier (LV) 0.10
Kyle Waters (ROC) 0.10
Chase Fraser (LV) 0.10
Austin Shanks (SK) 0.10
CJ Kirst (TOR) 0.09
Michael Sowers (PHI) 0.09
Jack Hannah (COL) 0.09
Reilly O’Connor (OTT) 0.09
Owen Hiltz (TOR) 0.09
Larson Sundown (OTT) 0.09
Sam LeClair (PHI) 0.09
Ryan Smith (ROC) 0.09
Ryan Lanchbury (ROC) 0.09
Josh Byrne (BUF) 0.09
Mitch Jones (LV) 0.09
Dylan Watson (SD) 0.09
Adam Charalambides (VAN) 0.09
Kyle Buchanan (BUF) 0.09
An interesting list, right? Three types of players kinda jump out at you when reviewing the above names: players producing at an overall high rate, secondary offensive players knowing their role but still contributing consistently, and players who need to be more involved and engaged in their team’s overall offense by increasing their touch count and contributing more - we’ll let you decide who goes where.