
Clutch Kings: Winning When it Really Counts
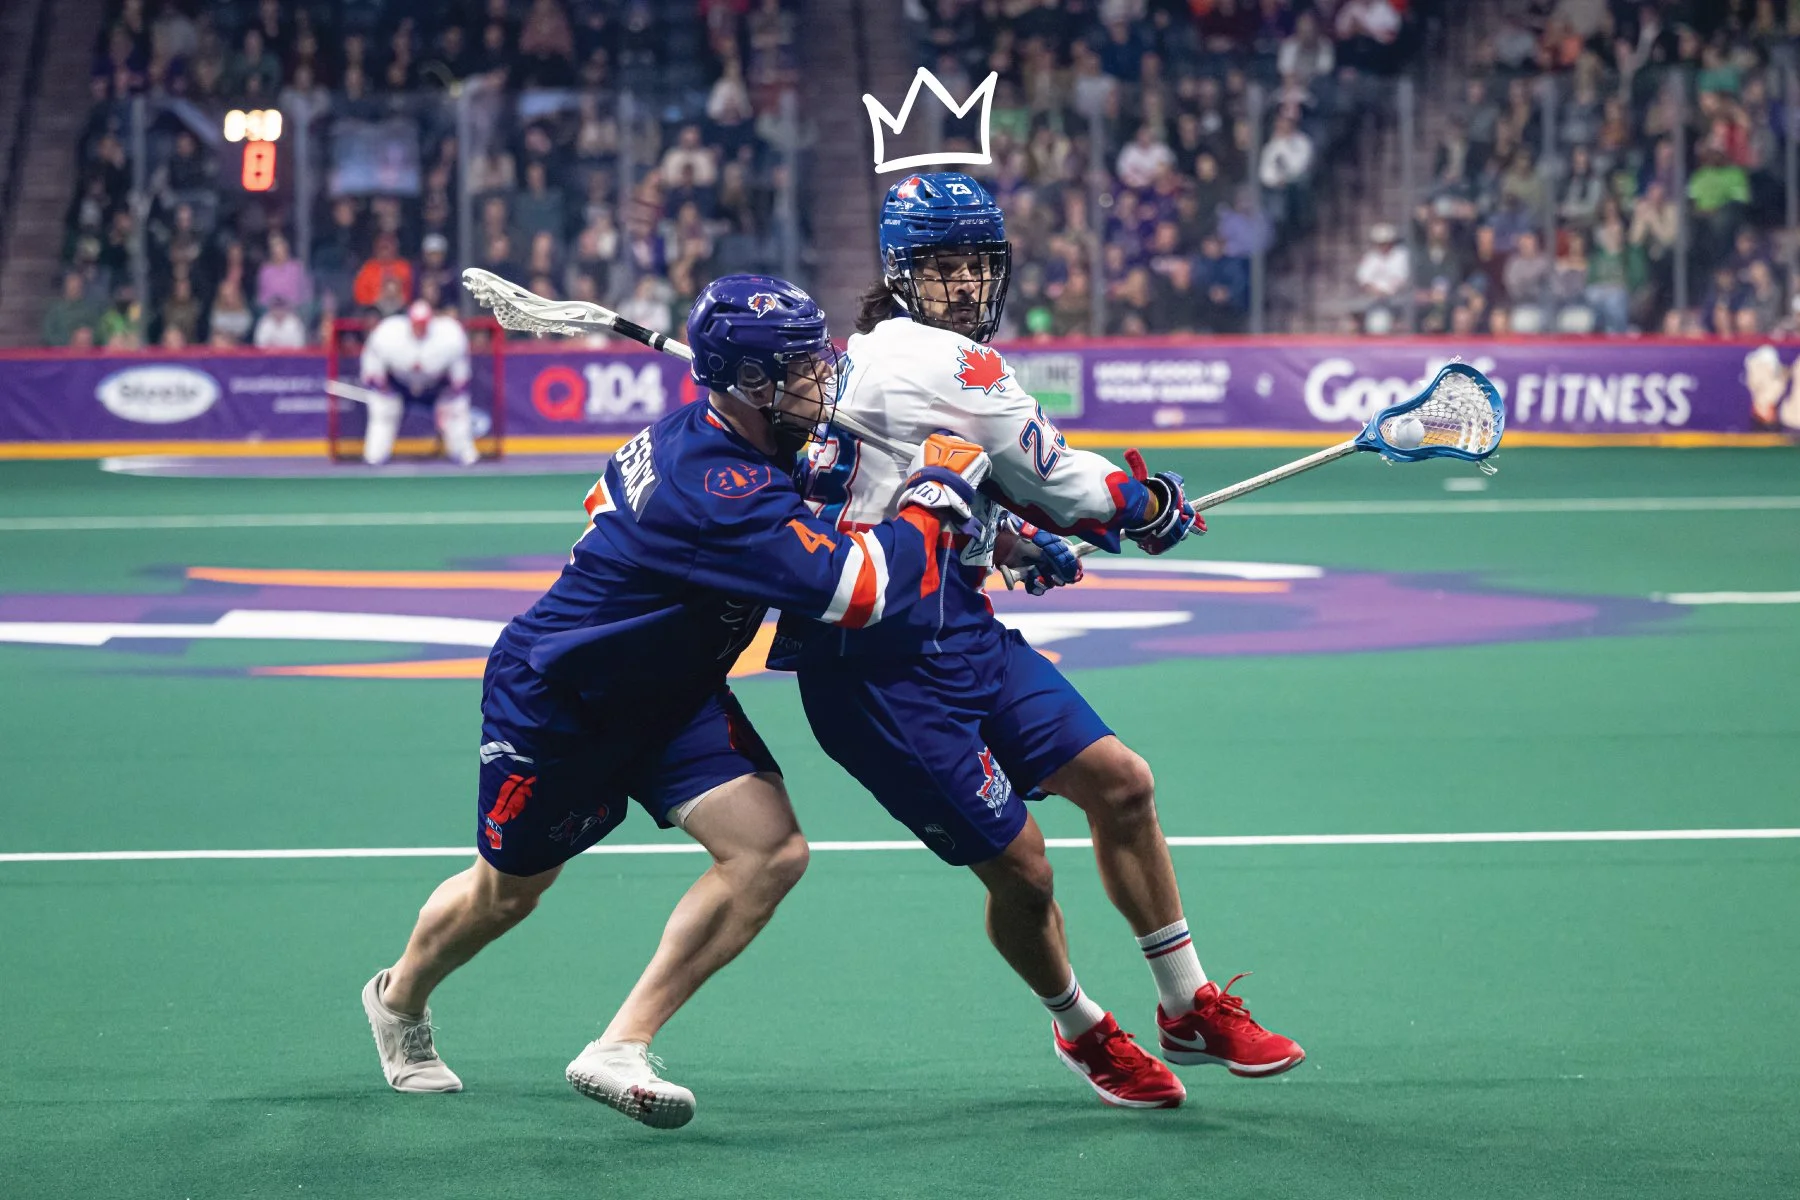
Challen Rogers, Toronto Rock (Photo: James Bennett)
The Lax Mag’s Clutch Kings tracks an individual player’s game-tying, go-ahead and game-winning goals, then weighs them based on when they’re scored (first, second, third or fourth quarter, plus OT), but also in what on-floor situation they’re finished (even-strength, power-play or short-handed goals). The Clutch Kings countdown calculates the league’s most money goal scorer all season long, crowning the king at the conclusion of the current NLL campaign. Click here for a more detailed breakdown of Clutch Kings scoring.
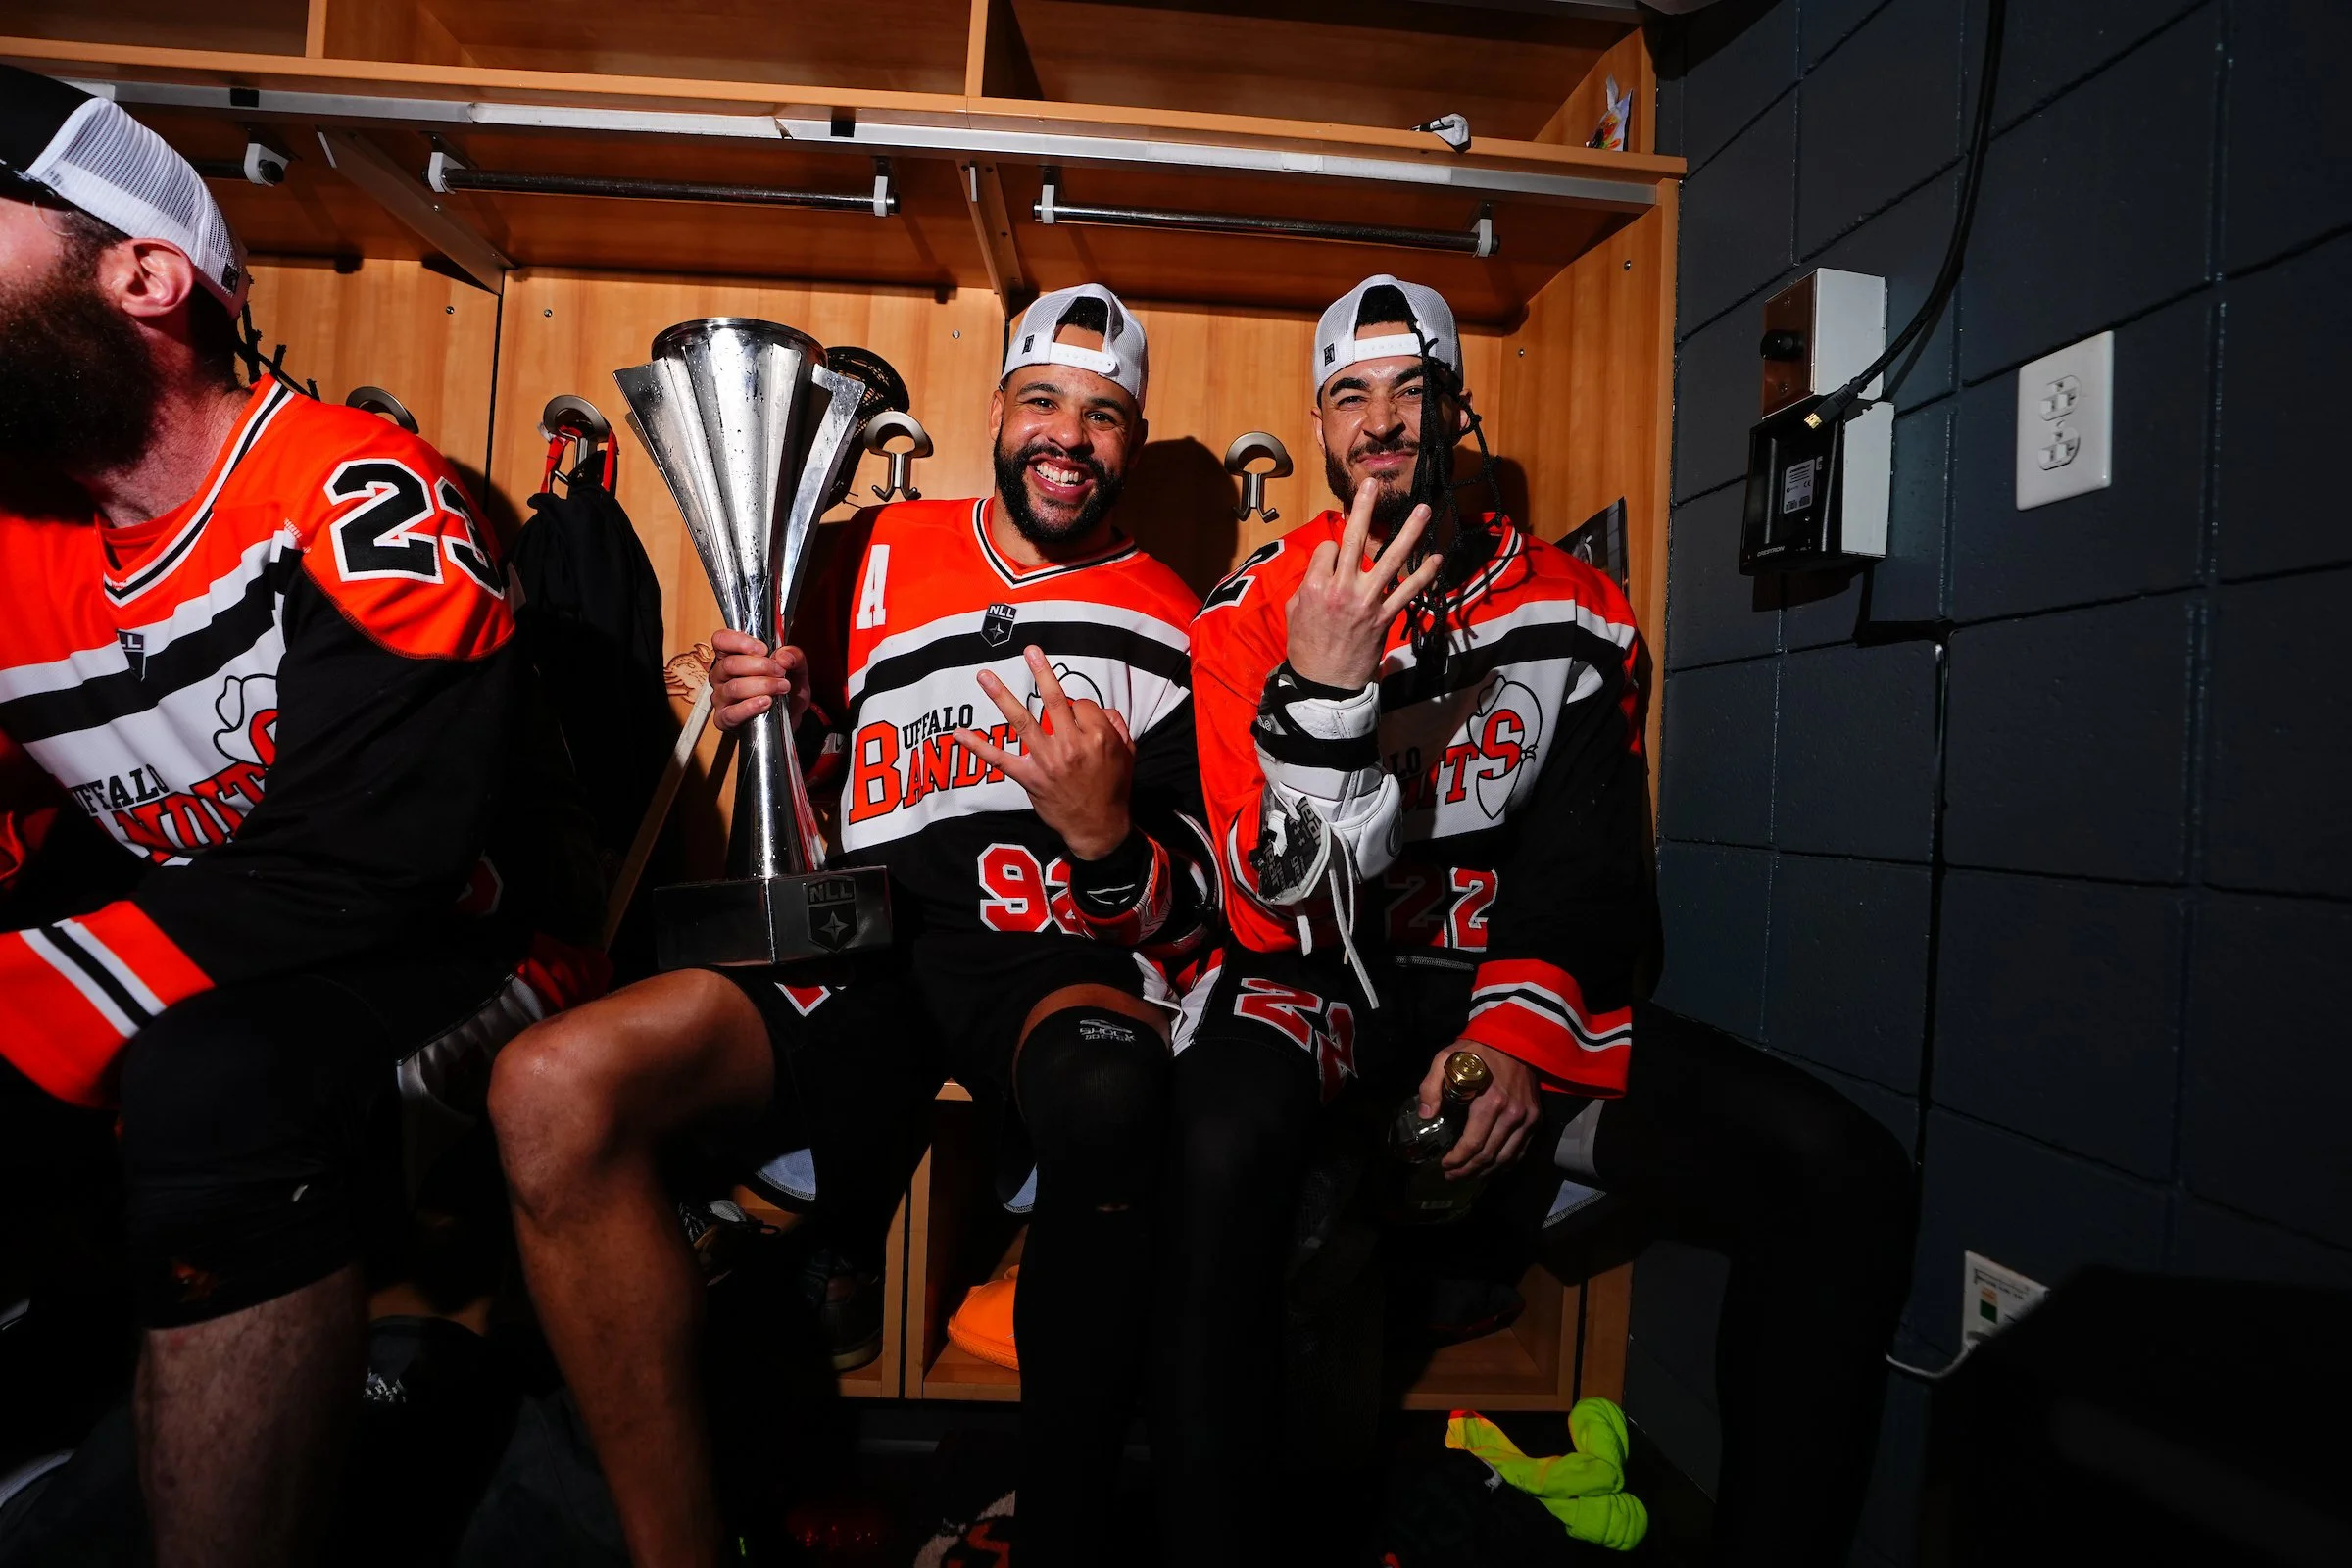
Dhane Smith and Josh Byrne (Photo: Buffalo Bandits)
While the two points teams earned (and yes, we know NLL standings go by winning %, relax) early in the season mean as much in the standings as March Ws, when it comes to winning the NLL Cup, anything you did in December through February, doesn’t translate to much.
In this week’s Clutch Kings, we take a closer look at why the last five weeks of the NLL’s regular season are extremely important to setting yourself up for Cup-winning success, plus the teams and players that are heating up (and cooling off) at this critical time of the year.
Over the past two decades, eventual Cup winners have done exceptionally well over those all-important five weeks that take place prior to the playoffs. In fact, Cup winners have gone 77-35 over that time, and all but three champions since 2005 finished with a record higher than .500 over the last five weeks.
Below, see how Cup winners over the past two decades have done during the last five weeks of the NLL season.
Season: Team, Last 5 Weeks (Full Season)
2025: Buffalo Bandits, 3-3 (13-5)
2024: Buffalo Bandits, 4-1 (11-7)
2023: Buffalo Bandits, 4-1 (14-4)
2022: Colorado Mammoth, 3-2 (10-8)
2019: Calgary Roughnecks, 4-1 (10-8)
2018: Saskatchewan Rush, 3-2 (14-4)
2017: Georgia Swarm, 5-1 (13-5)
2016: Saskatchewan Rush, 4-2 (13-5)
2015: Edmonton Rush, 6-1 (13-5)
2014: Rochester Knighthawks, 5-1 (14-4)
2013: Rochester Knighthawks, 4-2 (8-8)
2012: Rochester Knighthawks, 2-4 (7-9)
2011: Toronto Rock, 1-4 (10-6)
2010: Washington Stealth, 4-2 (11-5)
2009: Calgary Roughnecks, 5-2 (12-4)
2008: Buffalo Bandits, 3-1 (10-6)
2007: Rochester Knighthawks, 6-0 (14-2)
2006: Colorado Mammoth, 5-1 (10-6)
2005: Toronto Rock, 6-1 (12-4)
The only three teams to buck that trend were the 2011 Toronto Rock, 2012 Rochester Knighthawks, and last year’s Buffalo Bandits. Click those links and look at their rosters. All three were loaded up with past champs and future Hall of Famers. So, unless your roster is all-time stacked, you probably want to start heating up in these final five weeks.
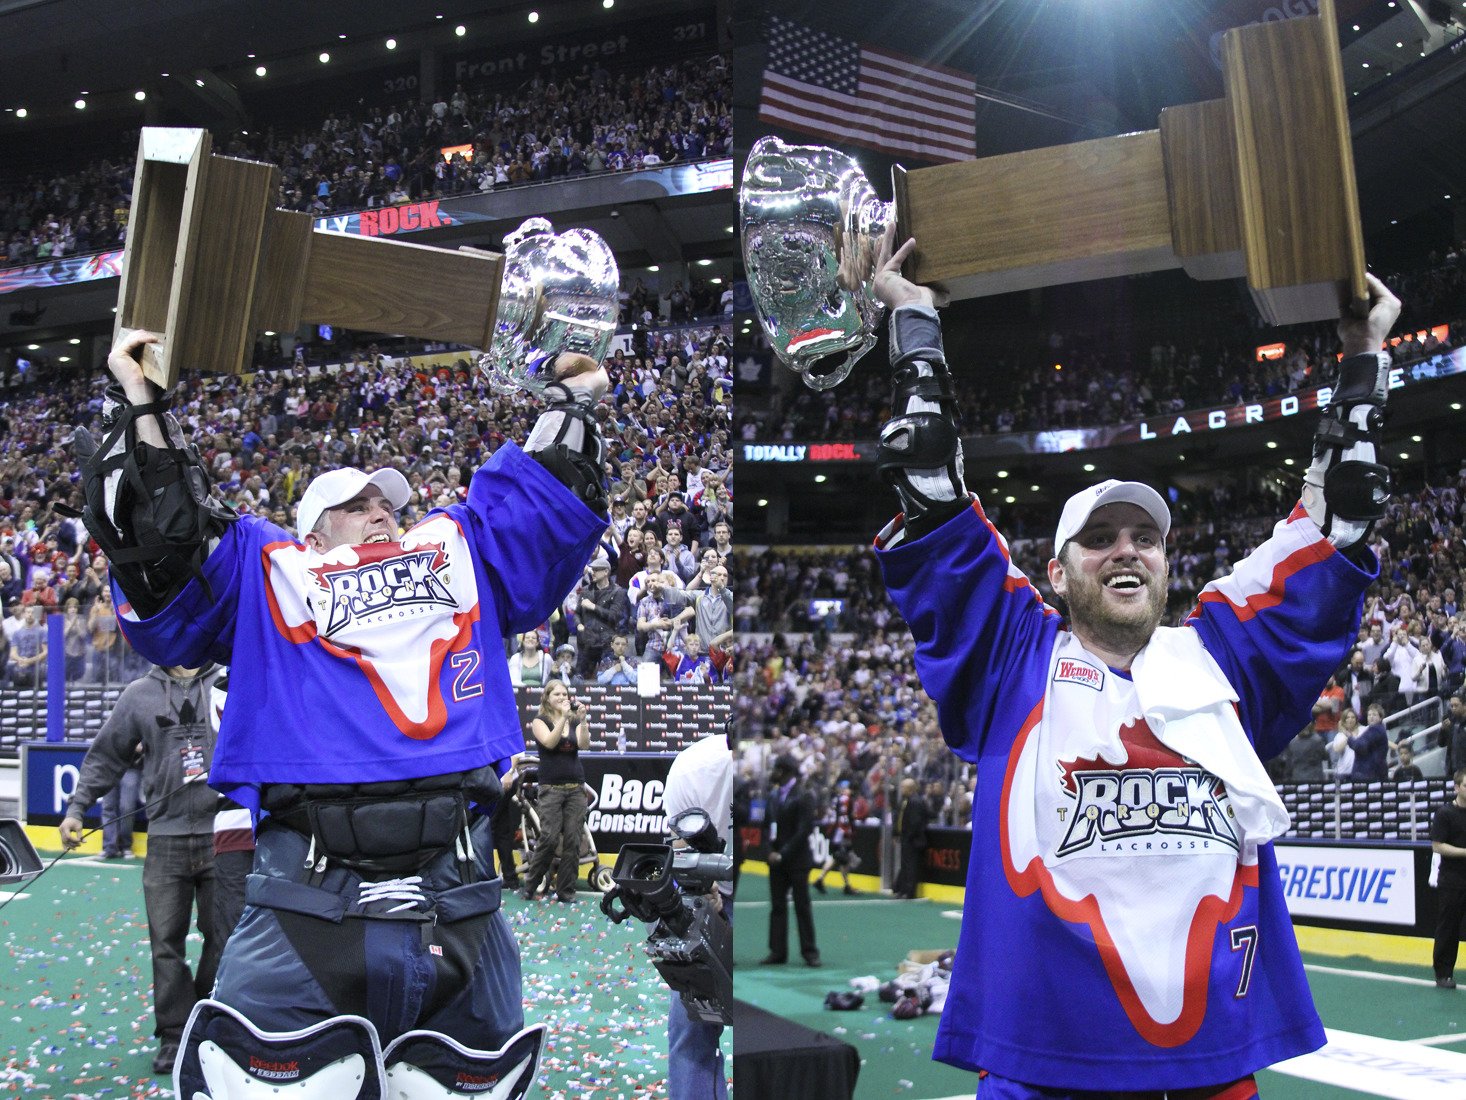
Bob Watson and Colin Doyle, 2005 NLL Cup (Photo: Ward Laforme Jr.)
With five weeks left this year, who looks likely to continue heating up, who’s completely cooled off, and who better starting winning again ASAP if they hope to claim a Cup in 2026.
Heating Up
Buffalo Bandits
We recently covered the four-peat-seeking Bandits inspired 2-0 weekend that put them firmly back in the playoff picture. Since then, they’ve won again. Former Clutch King winner Josh Byrne has most definitely started dialling his game in when it matters most. Over Buffalo’s three-game win streak, Byrne has scored the winner in all of them.
Josh Byrne Goals Per Game
Week 1-11: 1.50
Weeks 12-16: 2.40
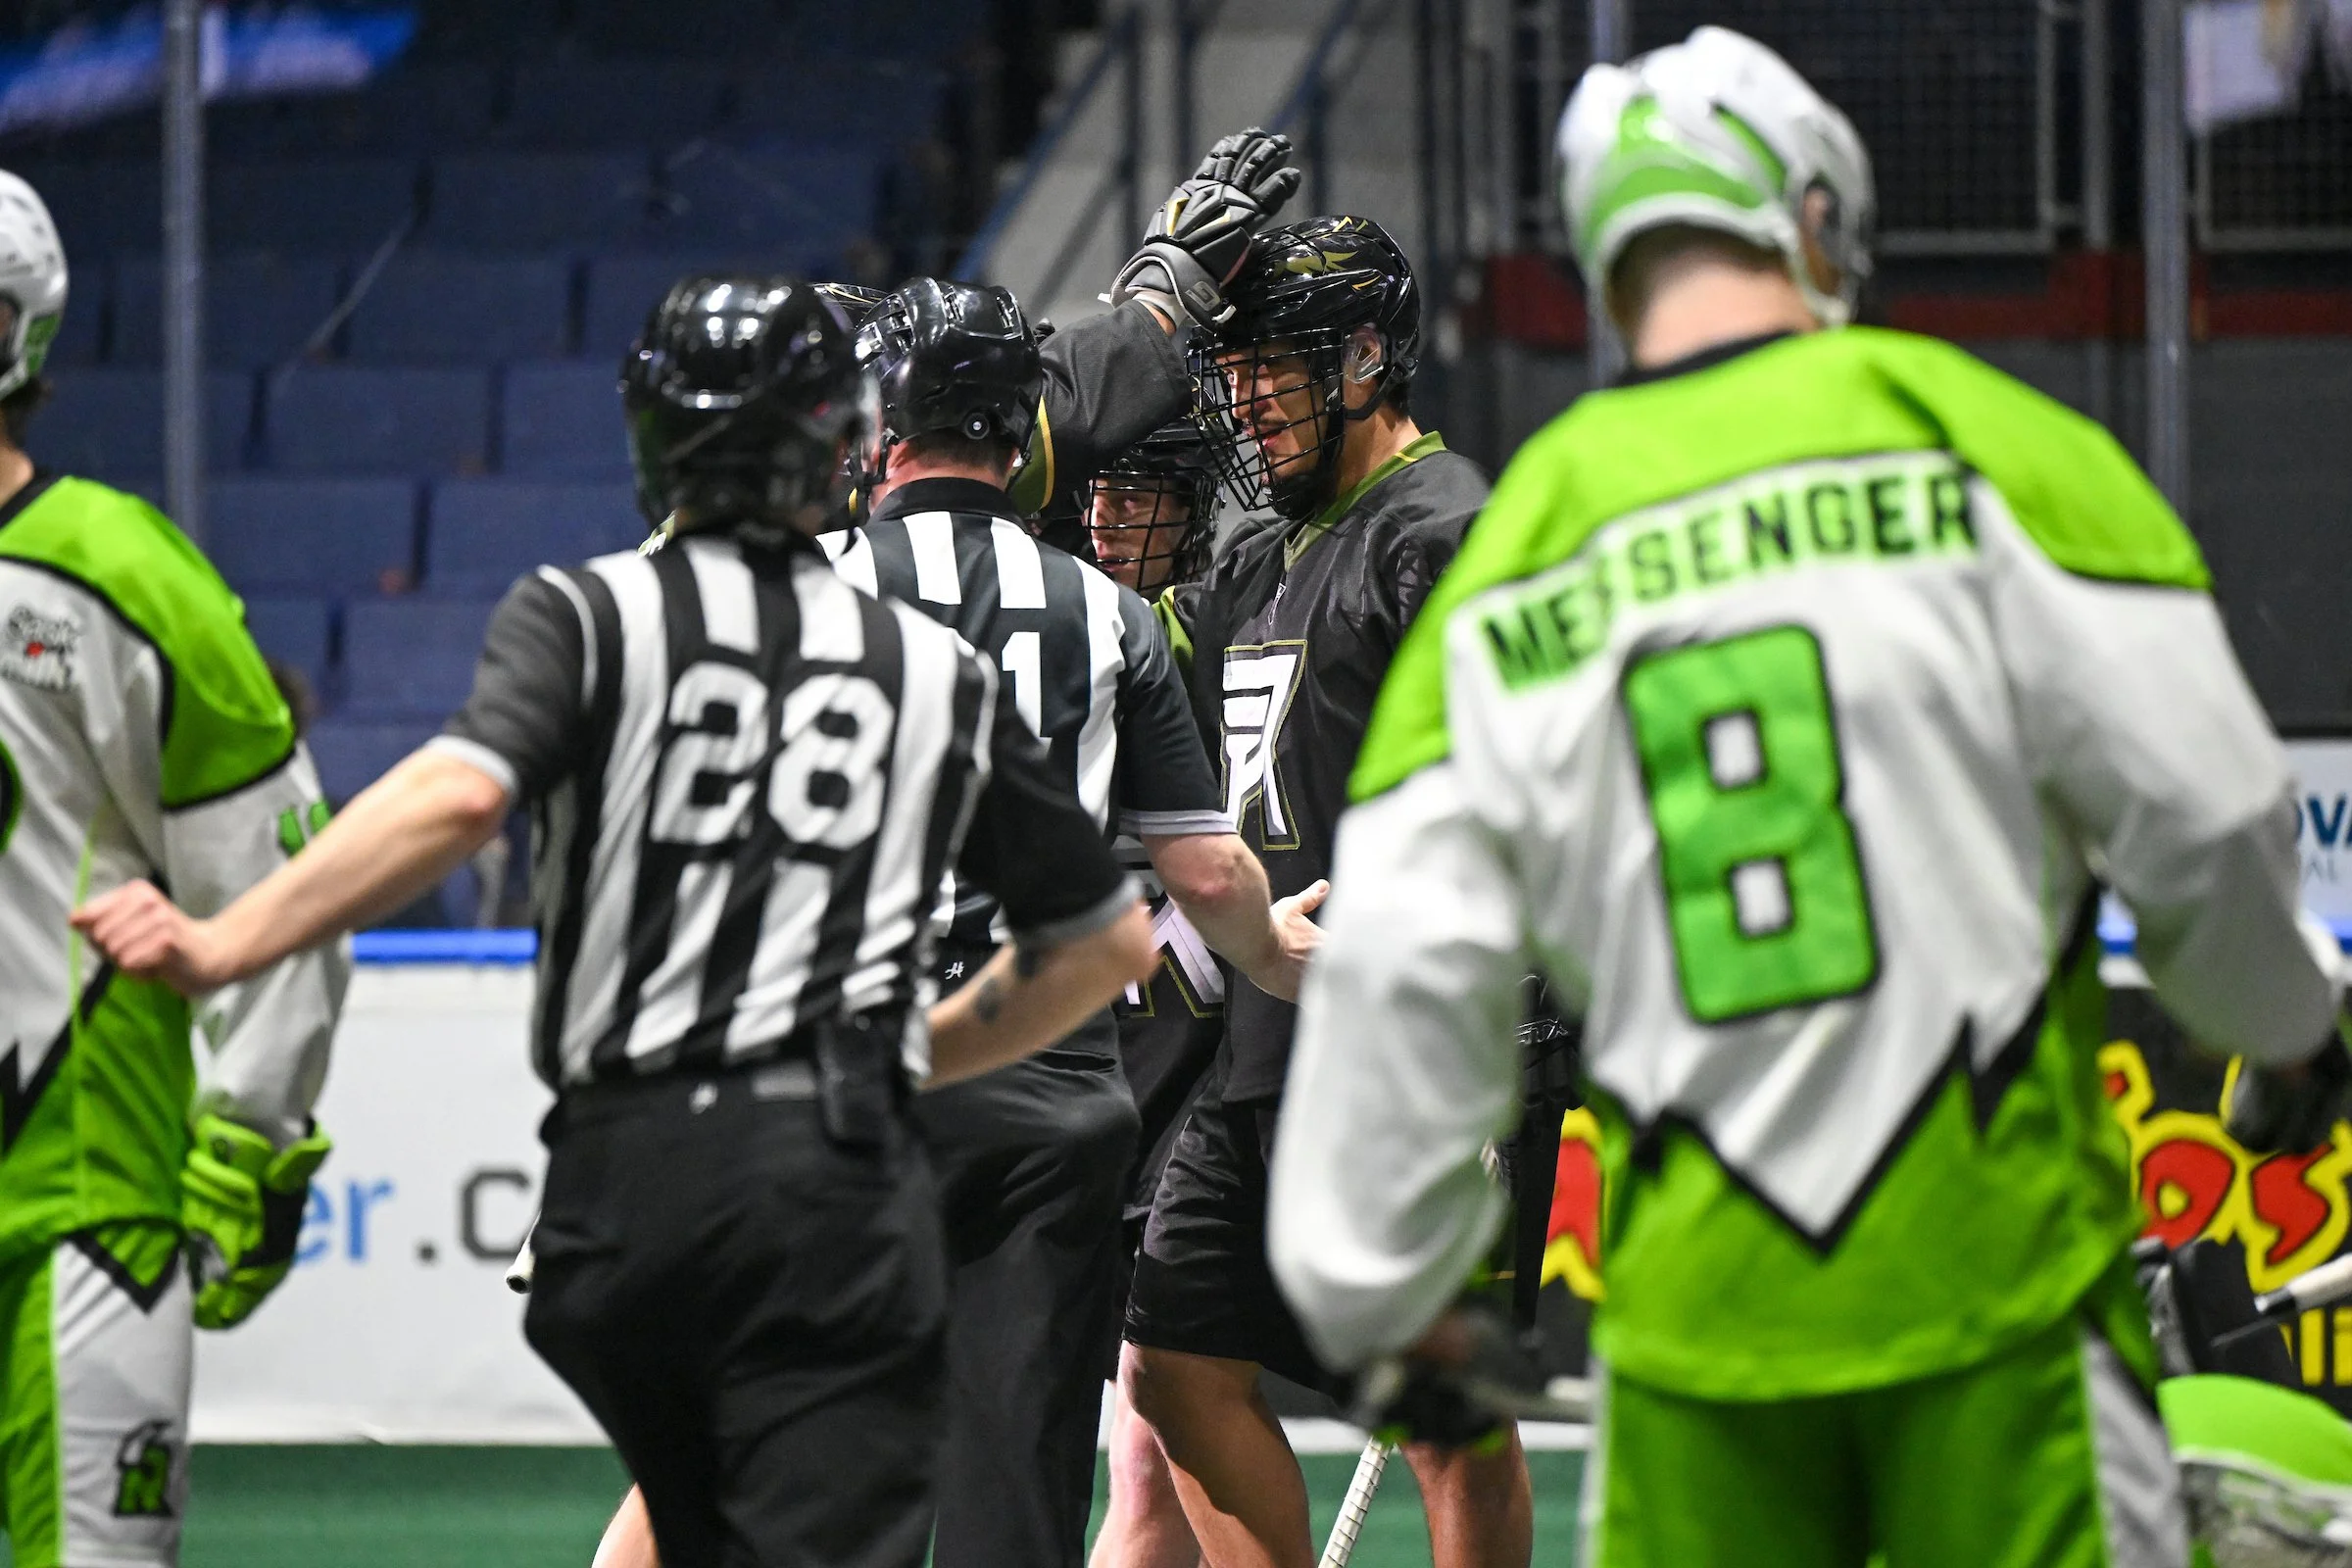
Toronto Rock
Winning their second straight for just the second time this year, last week’s OT thriller against Halifax was arguably their most clutch victory of the season, and not just because it went to extra innings. Of the 27 combined goals scored in Toronto’s win over Halifax, 20 were either game-tying, go-ahead, or of course Josh Dawick’s game-winning goal. Rock captain Challen Rogers scored both a late fourth quarter game-tying and go-ahead goal that obviously played a massive part in how that result played out. Rogers, who cracked out CK leaderboard this week for that performance, has cranked up his goal-scoring production significantly since mid-January.
Challen Rogers Goals Per Game
Weeks 1-9: 1.00
Weeks 10-16: 2.67
As we’ve outlined in the past, eventual Cup winners always have players that rank really high on our CK leaderboard (Rock rookie Owen Hiltz is holding steady at #2) and own multiple players on our season-ending leaderboard (Chris Boushy and Rogers rank right now too).
Calgary Roughnecks
Their chances of making the playoffs are about as slim as it gets, but we need to acknowledge the recent play of the Calgary Roughnecks, who convincingly beat both Rochester and Ottawa over the past two weeks. As mentioned in recent weeks, Calgary’s Tanner Cook, who is tied for fourth on our leaderboard this week, has been one of this year’s most relied-on scorers and also leads the league in hat-tricks. Also, based on our CK calculations, Cook has scored almost a third of all of Calgary’s game-tying, go-ahead and game-winning goals this year. That’s significant.
Cooling Off
Rochester Knighthawks
Starting the season 4-1, the Knighthawks, who have gone 1-6 since, have not only cooled down, they are about as ice cold as it gets. Just a half-game out of a playoff spot, they are obviously far from out of it, but that hot streak needs to restart right now. During that impressive early start, their offense was dropping up double digits with ease, a peak point total they now struggle to secure on a regular basis.
Rochester Goals Per Game
First Five Games: 14.20
Last Seven Games: 9.86
That is a massive drop. The Knighthawks have just eight players who’ve scored a game-tying, go-ahead or game-winning goal this year (only Vancouver & San Diego have fewer), relying on Connor Fields to do a bulk of their clutch scoring, but like the team, he’s kinda cooled off over that same stretch.
Connor Fields Goals Per Game
First Five Games: 3.20
Last Seven Games: 2.14
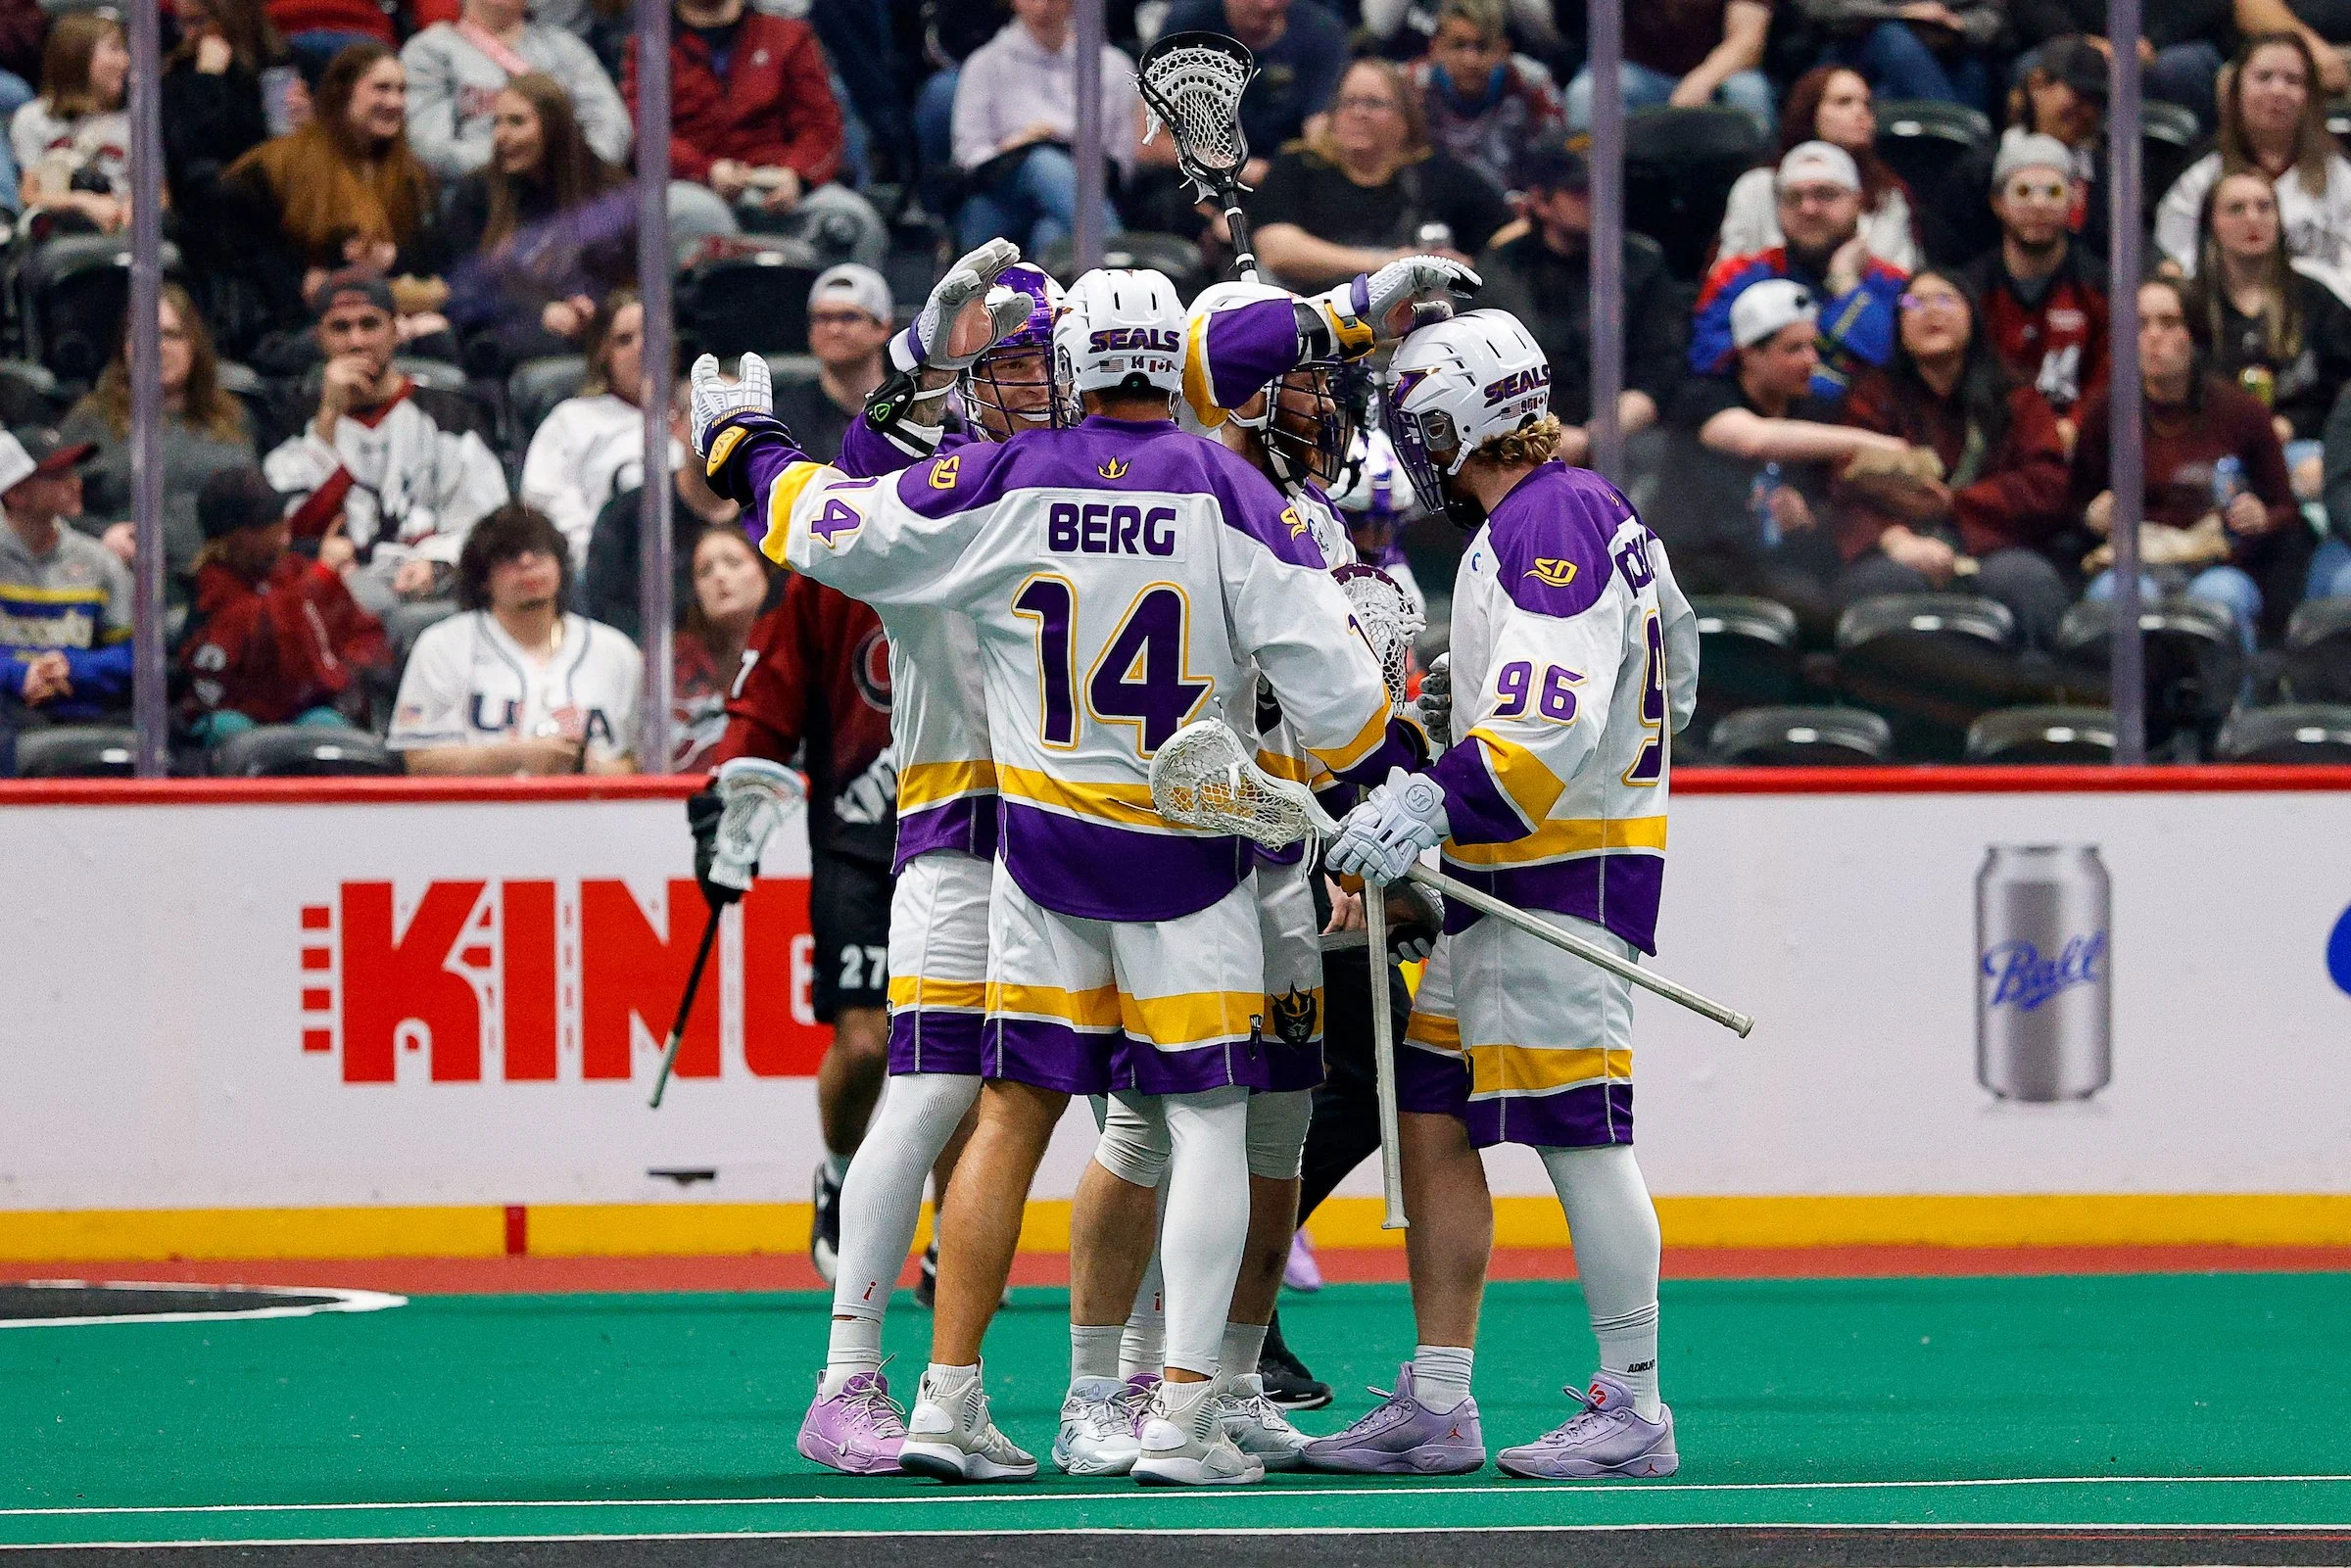
Wes Berg, San Diego Seals (Photo: Isaiah J. Downing)
San Diego Seals
The Seals had a strong 5-1 run through most of January and February, but have since lost their mojo in games against better competition, going 0-3 (COL, VAN, SK) over their last three. With Buffalo, Toronto and Georgia next up, this L streak is going to be tough to snap. Last year, Seals forward Wes Berg had a brilliant back half of the 2025 season, and won our Clutch King crown. This year, both in straight and clutch production has seen a dramatic decline, Berg on pace to post career lows pretty much across the board.
West Berg Goals Per Game
2025: 2.72
2026: 1.38
West Berg Clutch Goals
2025: 8 GTG, 6 GAG, 5 GWG
2026: 1 GTG, 0 GAG, 0 GWG
Saskatchewan at Rochester, Week 14 (Photo: Micheline Veluvolu)
Luke Warm
Saskatchewan & Colorado
Probably a bit early to say they’ve completely iced over, but the Saskatchewan Rush and Colorado Mammoth are kinda creeping towards that frostbitten territory.
After an almost spotless 10-1 start to the season (remember what we reviewed about starts not translating to Cups), the Rush are just 1-2 over their last three. An OT loss to Buffalo, another OTL to an icy Rochester, and last week just barely beating the frigid Seals. They close out playing the Bandits again, Colorado, and twice against Toronto. That is not an easy final five weeks (there’s a bye mixed in there too). Sask has already qualified for the playoffs, but need to get things back on track if they hope to challenge for the Cup.
A very similar story in Denver, where the Mammoth have seriously struggled as of late. Coming off a spicy 7-0 run spearheaded by Andrew Kew, the team has gone just 1-3 since and look more pretender than Cup contender in recent weeks. Unlike the Rush, Colorado’s final five weeks is seemingly a lot light: Vegas, Sask, and two against Calgary, who as we outlined above, aren’t going down lightly. So maybe not so light.
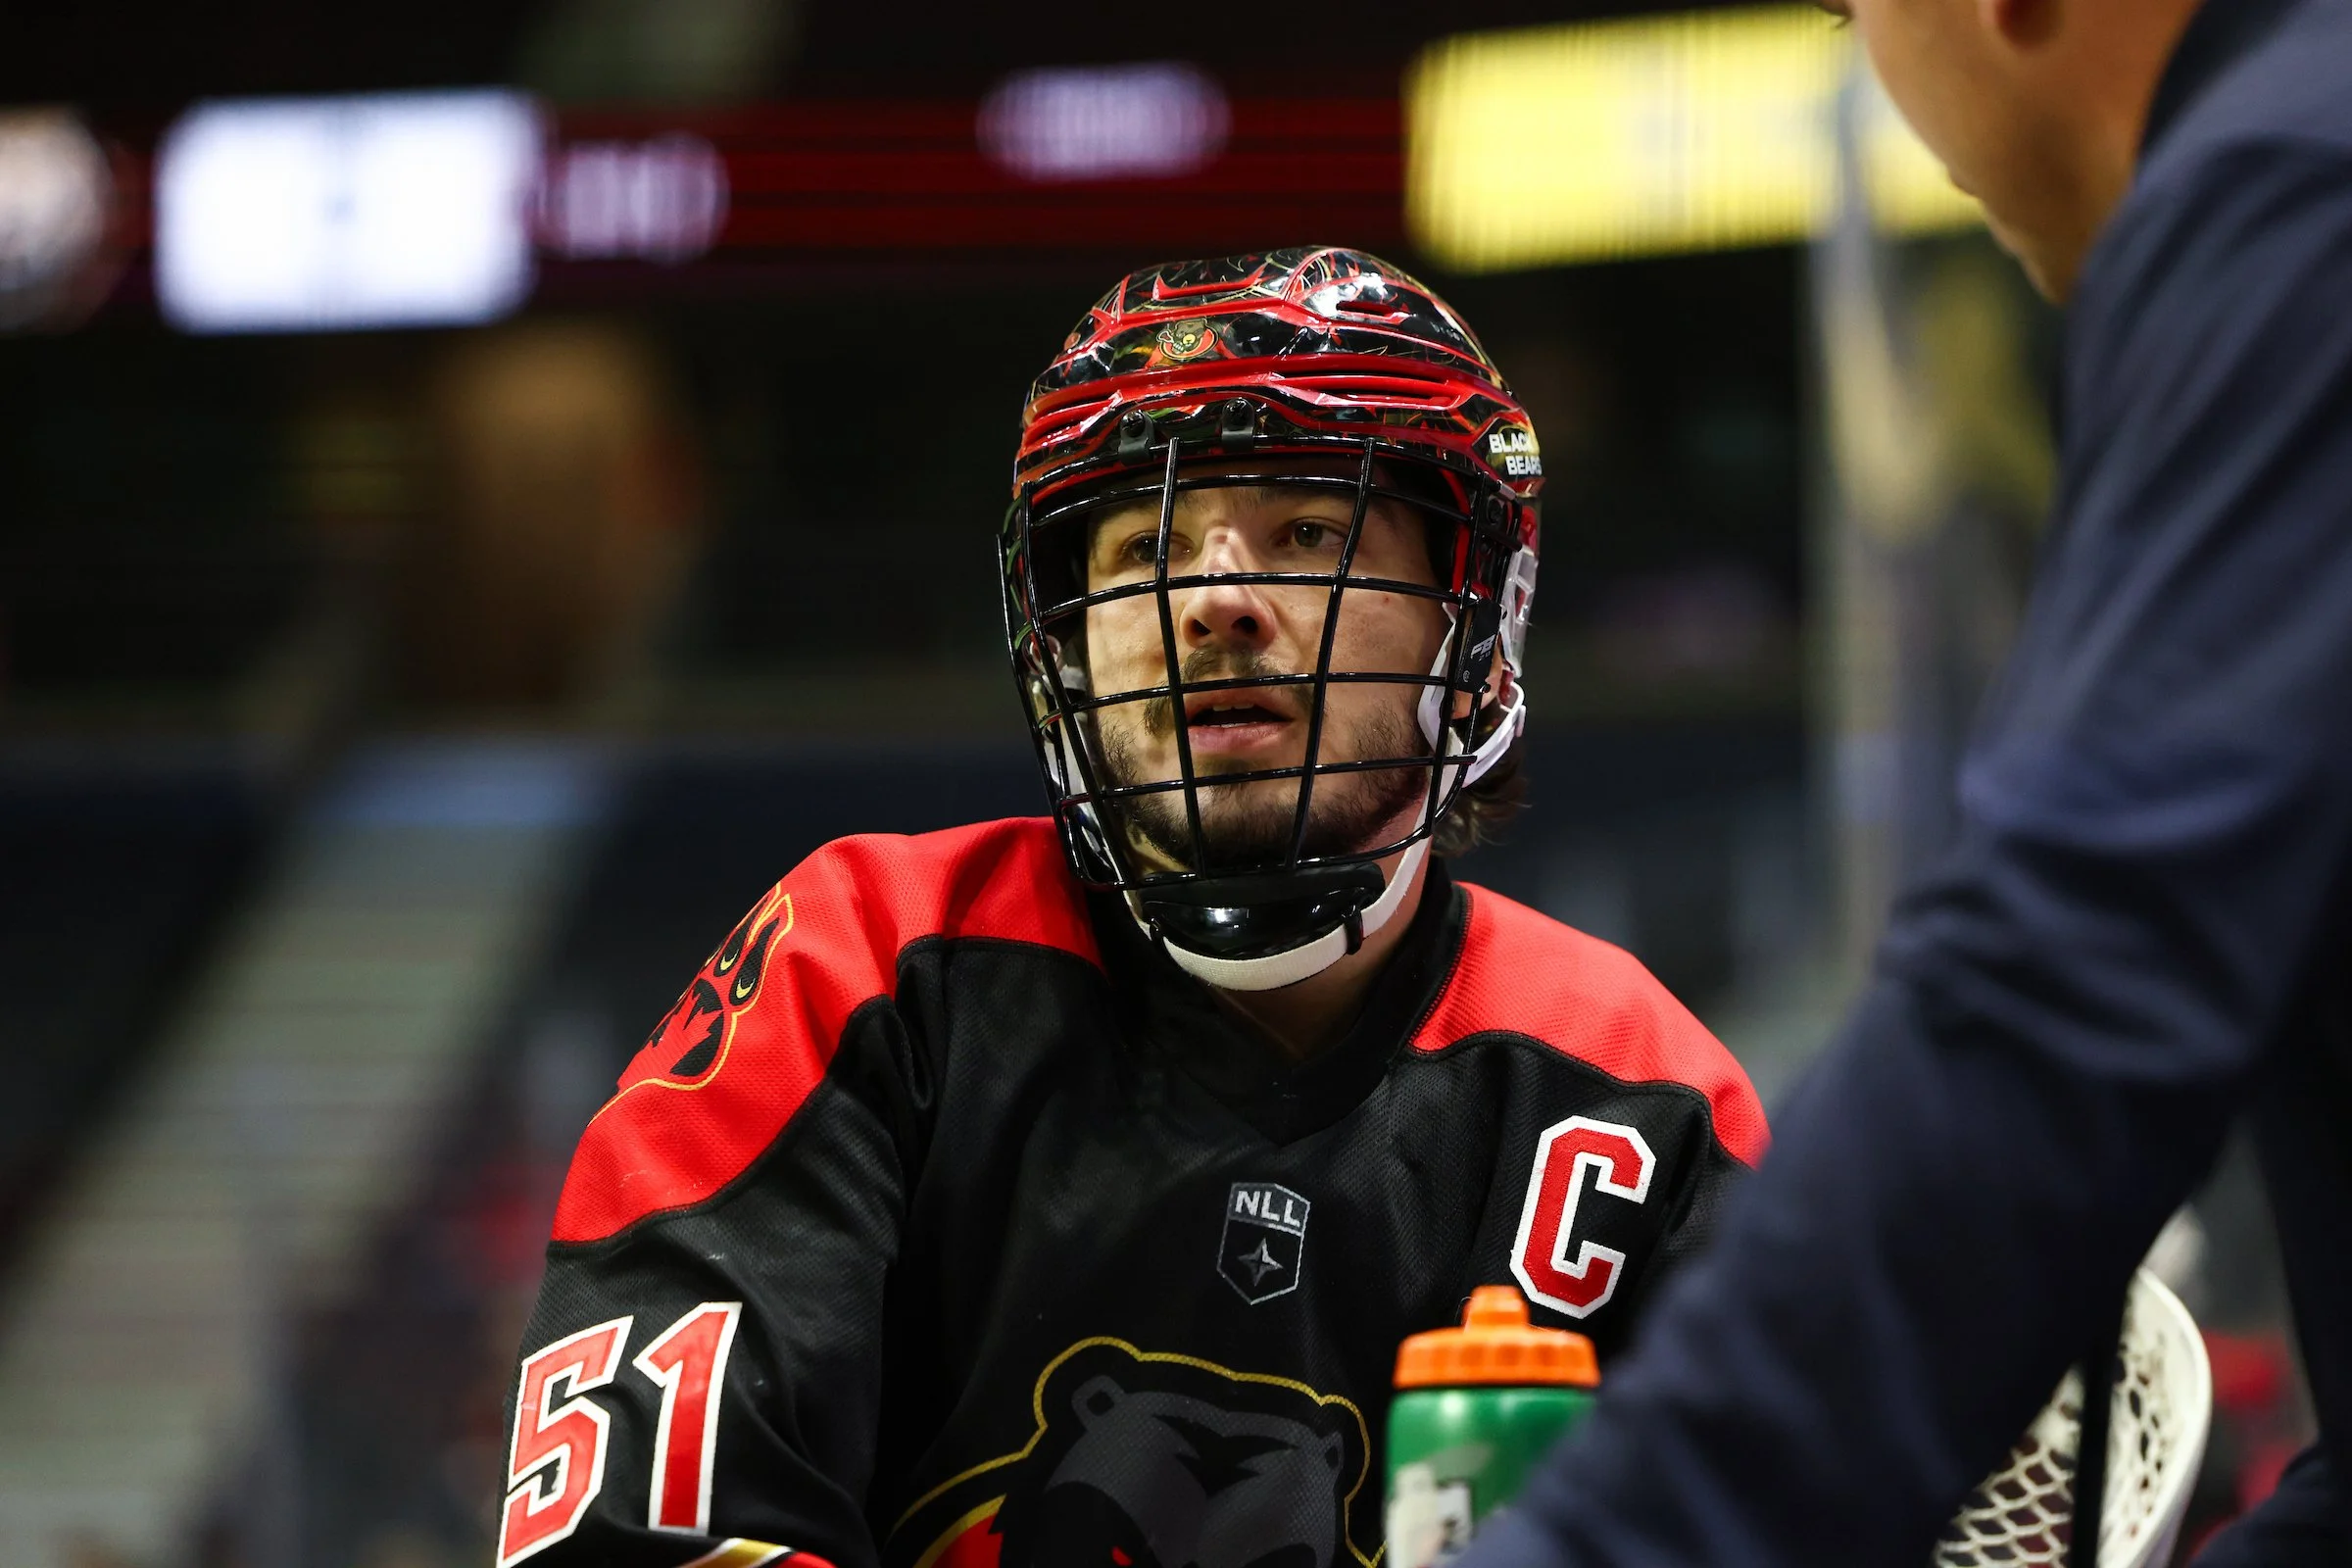
Jeff Teat, Ottawa Black Bears (Photo: Greg Mason)
Jeff Teat remains #1 on our Clutch Kings leaderboard, holding onto a tiny lead over the previously mentioned Hiltz and Saskatchewan’s Zach Manns.
Clutch Kings: Week 17
CKs Rank. Player (NLL G Rank) Team, CK Points (GTG/GAG/GWG)
1. Jeff Teat (T1) Ottawa, 28.25 (5/7/2)
2. Owen Hiltz (T22) Toronto, 26.25 (5/5/2)
3. Zach Manns (T8) Saskatchewan, 25.25 (5/4/4)
T4. Dhane Smith (T11) Buffalo, 18.50 (3/3/2)
T4. Tanner Cook (4) Calgary, 18.50 (4/4/2)
6. Josh Byrne (T22) Buffalo, 17.50 (0/1/4)
7. Shayne Jackson (29) Georgia, 17.00 (1/4/4)
8. Andrew Kew (T1) Colorado, 16.75 (3/3/3)
9. Curtis Dickson (3) Vancouver, 16.25 (3/2/3)
10. Robert Church (T15) Saskatchewan, 16.00 (2/2/2)
T11. Clarke Petterson (T11) Halifax, 15.75 (3/4/1)
T11. Jesse King (T11) Vancouver, 15.75 (4/5/1)
13. Connor Fields (T8) Rochester, 15.00 (4/2/2)
T14. Reilly O'Connor (T31) Ottawa, 14.00 (1/1/3)
T14. Chris Boushy (T37) Toronto, 14.00 (4/2/2)
16. Ethan Walker (T60) Oshawa, 13.50 (2/1/3)
17. Tye Kurtz (7) Oshawa, 13.25 (1/5/1)
18. Nolan Byrne (T31) Georgia, 13.00 (5/2/1)
19. Cody Jamieson (T46) Halifax, 12.75 (3/3/1)
T20. Tre Leclaire (T15) San Diego, 12.50 (3/1/2)
T20. Challen Rogers (T22) Toronto, 12.50 (3/4/0)
Scoring System
First 3 Quarters (GTG/GAG/GWG)
Even-Strength Goal: 1.00/1.50/2.00
Power-Play Goal: 0.50/0.75/1.00
Short-Handed Goal: 2.00/3.00/4.00
Fourth Quarter (GTG/GAG/GWG)
Even-Strength Goal: 2.00/3.00/4.00
Power-Play Goal: 1.00/1.50/2.00
Short-Handed Goal: 4.00/6.00/8.00
Overtime (GWG)
Even-Strength Goal: 6.00
Power-Play Goal: 3.00
Short-Handed Goal: 12.00